Table of Contents
ToggleWhat is Z Test
A z test is a statistical test in hypothesis testing to determine whether two population means are different when the population variance is known and the sample size is large.
Z-tests are similar to t-tests. T-tests are used when we have a small sample size and the standard deviation is unknown.
When to use the z test
We can use z test for hypothesis testing if the following prior conditions are met.
- Normal distribution of data
- All data points are independent
- Standard deviation is known
- Sample Size ≥ 30
- Equal sample variance
As per the central limit theorem, as we increase the number of samples, there is more probability the data is normally distributed. Therefore we need more than 30 samples in the z-test for hypothesis testing to ensure the data is normally distributed.
If the population variance is unknown, we can still use the Z Test by estimating the population variance from the sample data. This is possible only if the number of sample data points is greater than 30.
Relation between z-score and Margin of Error
We can use the z-score to calculate the margin of error.
The margin of error = 2 x Standard deviation for sample distribution
Standard deviation for sample distribution = Population Standard Deviation / √n
Steps to conduct the Z-test
Here is the list of steps we use to conduct the z-test in hypothesis testing.
- Get the data
- Check for prior conditions
- Define null and alternative hypotheses
- Finalize a significant level or alpha
- Get the z-score
- Calculate the z-test statistic
- Evaluate the results
What Is a Z-Score?
The z-score or z-statistic is a number that represents how many standard deviations above or below a data point is from the population mean in normal distribution.
| Z Score Value | Significance |
|---|---|
| 0 | Data is at Mean. |
| 1 | Data is one standard deviation away from mean. |
| Positive | A +ve value indicates data is above mean. |
| Negative | A -ve value indicates data is below mean. |
Significance of Z-test in Machine Learning
We can use hypothesis testing or z-test in machine learning to:
- Evaluate the ML model’s performance
- Determine ML model parameters’ significance.
- Evaluate a model’s accuracy
- Test the statistical validity of machine learning algorithms like linear regression and logistic regression.
We can use a z-test to compare the means of two data groups to determine if there is a significant difference between them. We can Improve the ML model using this information, or select the best set of features.
Types of Z Test in Hypothesis Testing
Here is the list of various types of z-test for hypothesis testing.
- Z-test for Means
- Z-test for Proportions
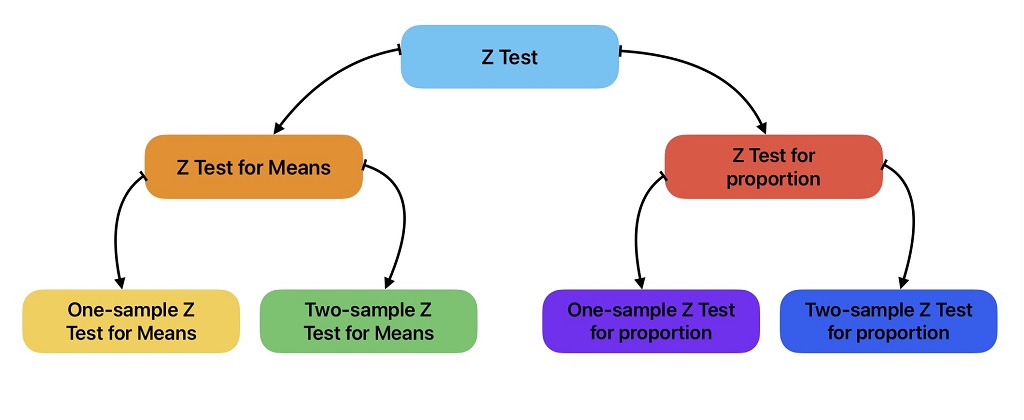
Z Test for Means
We use z-test for means to compare the means of two samples or sample and the population mean. We can further classify z test for means into two types:
- One sample z test for means
- Two Sample z test for means
One-Sample Z-Test for Means
One-sample z-test is used to compare the sample mean with the population mean. In other words, it checks whether the sample belongs to the given population using Z-statistics. This test is similar to one-sample t-test.
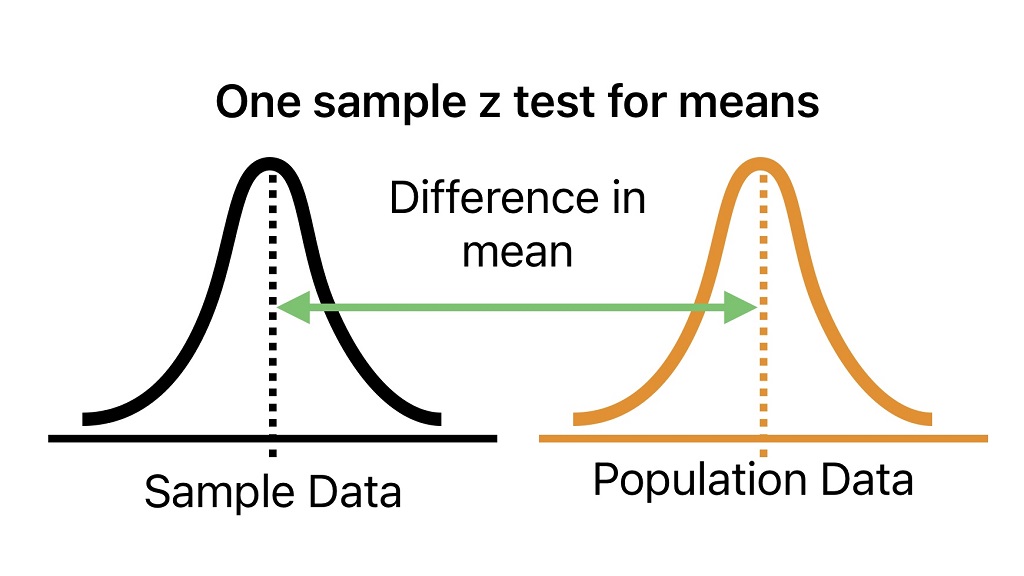
In this test, we try to determine how far the sample mean is from the population mean in terms of the number of standard deviations. Afterward, we determine if this deviation is statistically significant by comparing z-statistics and critical values.
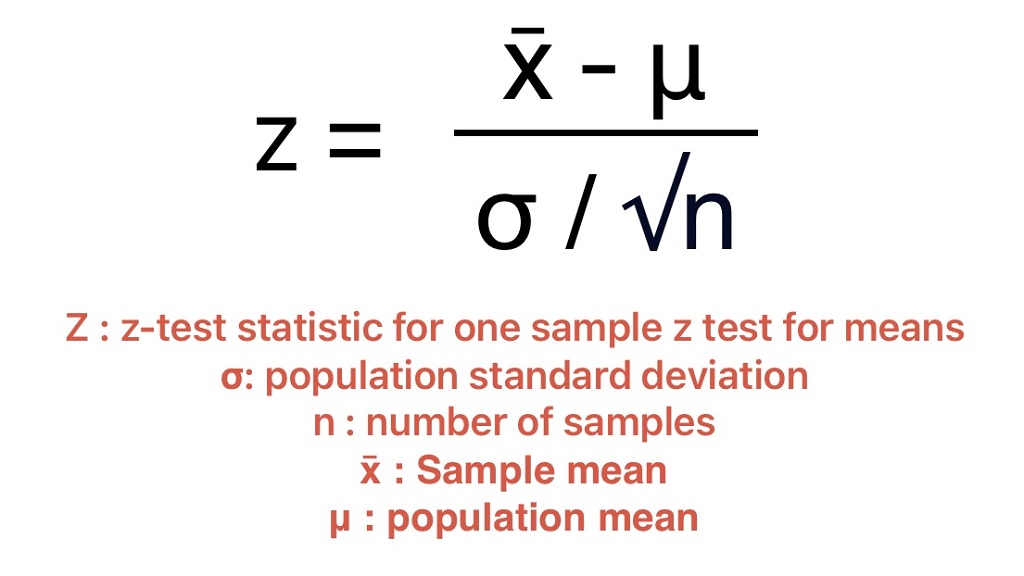
Calculation Formula
We can use one sample z-test to determine:
- If the average part diameter is 15mm.
- Whether the average monthly stock return is greater than 2%.
Problem Statement Example
Determine if a packing average weight is 50 grams considering we have sample weight data for 35 samples. From production data, we know that the standard deviation for packing weight is 1.5.
Solution
Here we can use z test to prove or reject the statement.
Step-1: Get the Sample Data
We collect 35 packings randomly from the production line and record their weight.
50, 49, 51, 49.5, 49, 48.8, 51.2, 50.8, 50.6, 49.95, 50.1, 50.9, 47.3, 47.6, 50, 51.2, 50.8, 50.6, 49, 48.8, 51.2, 50.8, 50.5, 49.95, 50.12, 50.9, 47.8, 47.6, 50, 49.2, 47.8, 48, 48.5, 51.2, 50.2
Step-2: Check if we can use the z test
Next step to to check if we can use the z-test for this hypothesis testing.
- Normal distribution of data : Test of normality is found ok
- All data points are independent: Yes independent samples are considered.
- Standard deviation is known : Yes, value is given in problem statement
- Sample Size ≥ 30 : yes
- Equal sample variance: Not applicable for one sample test
Step-3: Define null and Alternative Hypotheses
Null Hypothesis: Packing Average weight is not equal to 50 grams.
Alternate Hypothesis: Packing Average weight is equal to 50 grams.
Step-4: Finalize Alpha
We are considering alpha = 0.05
Step-5: Calculate the z-statistic
Sample Mean = 49.72971, Population Mean = 50, Population Standard Deviation = 1.5, n = 35
Z-Statistics = (49.729 – 50) / (1.5 / √351) = – 0.271 / 0.2535 = -1.059
Step-6: Calculate the critical z-score or p-value from the Z-table
p-value for z-statistic(-1.059) = .2896
We suggest you read this article on how to calculate critical value and p-value from the z-table.
Step-7: Evaluate the results
Since:
Calculated p-value (.2896) > alpha (0.05)
The test results are not statistically significant and we can not reject the null hypothesis.
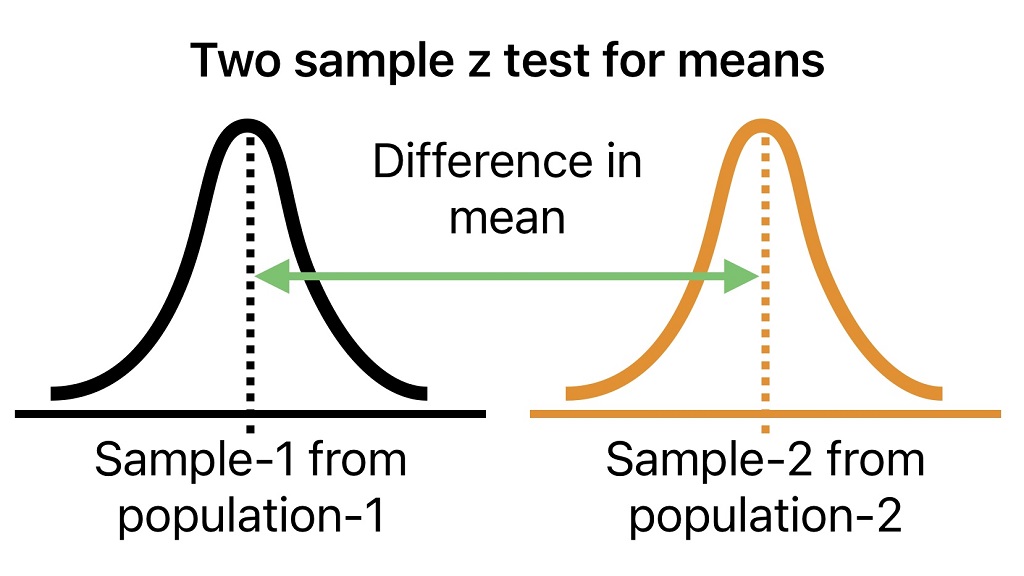
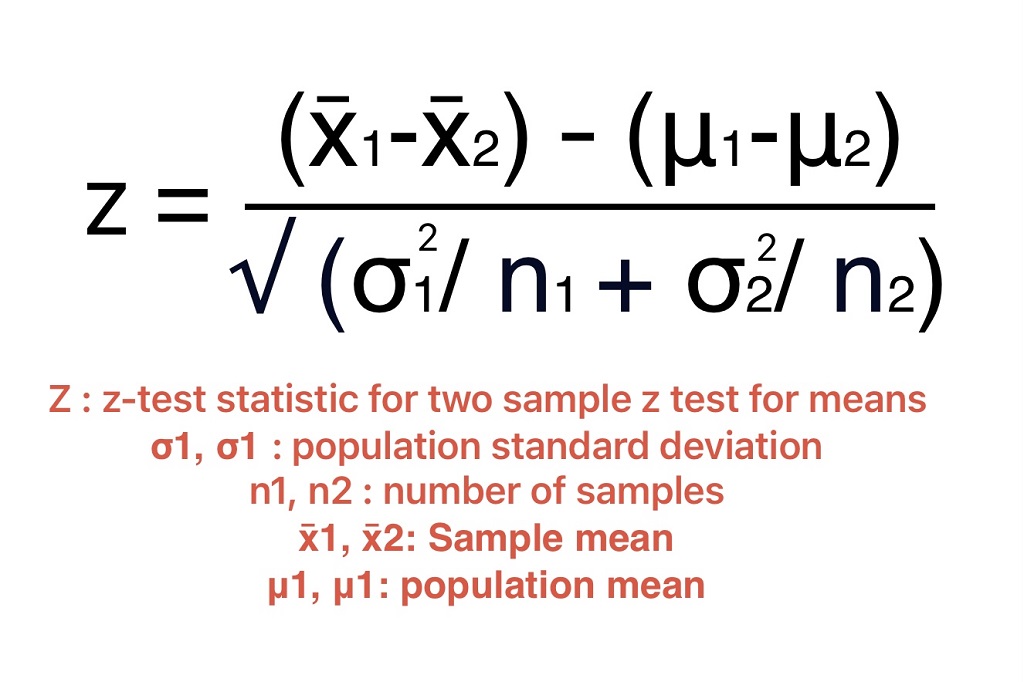
Two-Sample Z Test for means
A two-sample z-test is used to compare the means of two samples. We can use two sample z-tests for means to determine whether the means of two populations that generated the two samples are equal or different. This test is similar to an independent two-sample t-test.
Application Examples
Here is the list of application examples of two sample z-tests for means.
- Determine if there is a difference in average wait time at two restaurants.
- If there is a difference of 5 grams in packing average weight from two different machines (machine-1 and machine-2). From production data, we know that the average package weight from two machines is 45 grams and 50 grams respectively whereas a standard deviation of 1.5 and 1.3 is observed.
- If the average salary of the two groups is based on gender (male and female).
- Compare a website’s earnings with two different layouts.
- Compare the performance of two sections in a class.
Null and Alternate Hypothesis for two Sample z-test
Null hypothesis: There is no significant difference in the means of the two populations. => μ1 – μ2= 0
Alternate hypothesis: The means of the two populations are significantly different => μ1 – μ2≠ 0
Two sample z test for means calculation formula
Z Test for Proportions
We use z-test for proportions to compare proportions for two samples or sample and the hypothesized proportions. We can further classify z test for means into two types:
- One sample z test for proportions
- Two Sample z test for proportions
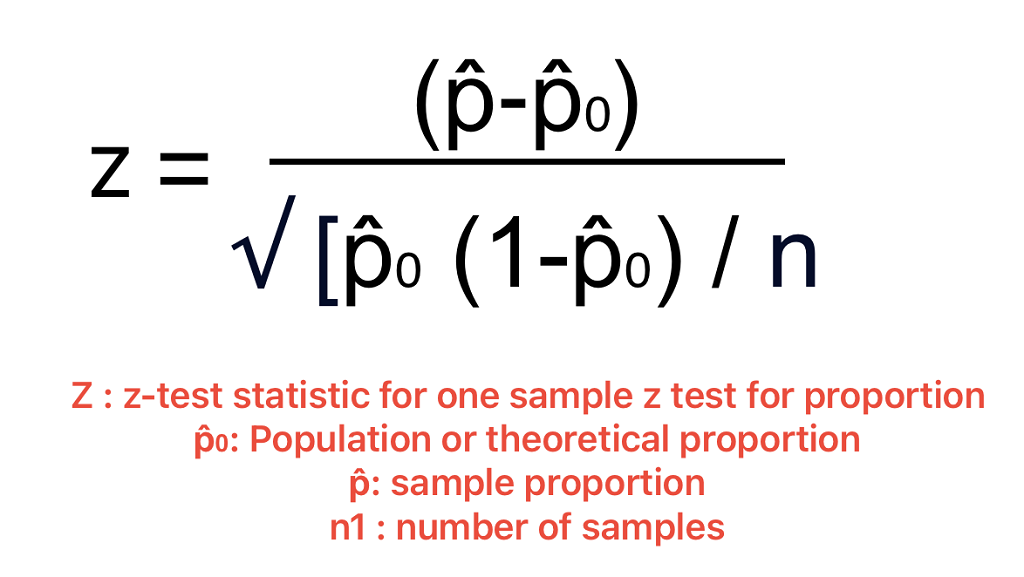
One-Sample Z-Test for Proportions
One-sample Z-test for proportion is a hypothesis test used to compare hypothesized proportion to a given theoretical population proportion. In other words, it checks whether there is a difference in hypothesized or sample proportion and population proportion.
We can use z-test to answer the following questions:
- Is there any difference in sample proportion and population proportion?
- Is the difference between population and sample proportion statistically significant?
Calculation formula for One sample z-test for proportions
Application Example for One sample z-test for proportion
A quality engineer wants to check whether there is a difference between population and sample proportion for the rejection rate for parts manufactured on a production line. The rejected part proportion is 5% during production, whereas it was 8% when we selected 50 random samples.
Is this difference in proportion statistically significant if the Level of Significance is 0.05?
Step-1: Collect the required data
Population Proportion (Po) = 0.05, Sample Proportion (P) = 0.08, number of samples (n) = 50, alpha = 0.05
Step-2: Check if we can use the z test
The next step to to check for the following prior conditions to conduct the z-test.
- Normal distribution of data: Test of normality is found ok
- All data points are independent: Yes independent samples are considered.
- Standard deviation is known: Yes, the value is given in the problem statement
- Sample Size ≥ 30: yes
- Equal sample variance: Yes
Step-3: Define null and alternative hypotheses
Null Hypothesis: There is no difference between the sample and production parts.
Alternate Hypothesis: Sample and production parts are different.
Step-4: Finalize alpha
Considering our application, we are considering alpha=0.05
Step-5: Calculate the z-statistic
Z-Statistics = (P – Po) / √ [Po (1 – Po) / n] = (0.08 – 0.05) / √ [0.05 * (1-0.05) / 50]
Z-Statistics = 0.03 / √ (0.000095) = 0.03 / 0.0308 = 0.974
Step-6: Calculate the critical value
p-value for z-statistic(0.974) = .330
We suggest you read this article on how to calculate critical value and p-value from the z-table.
Step-7: Evaluate the results
Since:
Calculated p-value (.330) > alpha (0.05)
The test results are not statistically significant and we can not reject the null hypothesis.
Example-2
We can use z-test for proportions to determine whether the proportion of government school students passing the IIT exam is similar to national proportion.
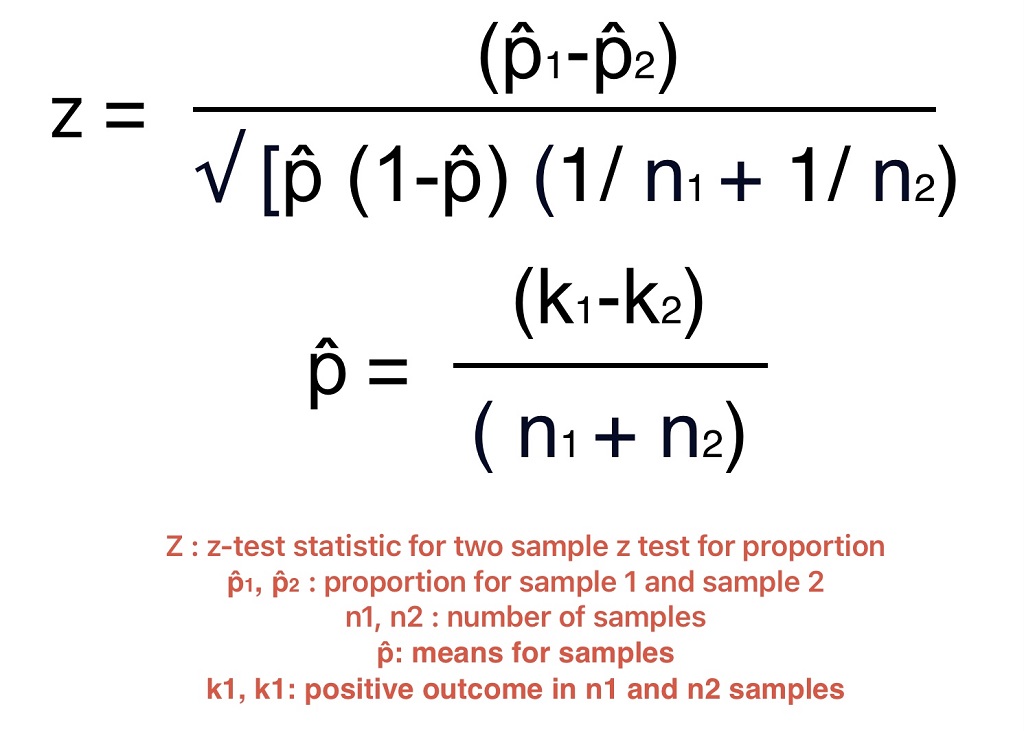
Two-Sample Z-Test for Proportions
Two-sample z-test for proportions is a hypothesis test that is used to determine if two samples are from the same population. We need population proportions for this test. We do not require any information on population standard deviation.
We can use this test for the following applications:
- Compare the proportion of users in two groups who can buy a product when they visit the store.
- A/B Testing: Compare reviews about a product on two user groups.
Null and Alternate Hypothesis for two Sample Z-test
Null hypothesis: Two populations are equal. => μ1 – μ2=0
Alternate hypothesis: The means of two populations are significantly different => μ1 – μ2=0
Calculation Formula
Application Example for Two-Sample Z-Test for Proportions
A marketing person wants to determine how different age groups customers think about a new product. We can use the two-proportion z test to determine if the proportion of customers who think positively about a new product is different in two groups.
In the first sample of 150 customers, 100 customers think positively about the product. Whereas, for the second sample of 200 customers 110 customers think positively about a new product.
Z-test Statistic Calculation
p̂1 = 100 / 150 = 0.66, p̂2 = 110 / 200 = 0.55, p̂ = (100+110) / (150+200) = 0.6
Z-Statistics = (p̂1 – p̂2) / √ [p (1-p) (1/n1 + 1/n2]]
Z-Statistics = (0.66 — 0.55) / √ [0.6 (1-0.6) (1/150 + 1/200)]
= 0.11 / √ [0.6 * 0.4 (0.0066+0.005)] = 0.11 / √ [0.6*0.4*0.0116]
= 0.11 / √ [0.6 * 0.4 * 0.0116] = 0.11 / 0.0431 = 2.55
P-value calculation from z-table
p-value for z-statistic(2.55) = .010772
We suggest you read this article on how to calculate critical value and p-value from the z-table.
Results Evaluation
Since:
Calculated p-value (.010772) < alpha (0.05)
The test results are statistically significant and we can reject the null hypothesis. In other words two populations are statistically different
Key Takeaways
We use the z-test in hypothesis testing to evaluate whether the test results are statistically significant or not. In other words, it checks whether the mean of two groups or a group and value is similar.
- Z-test is a statistical test to determine whether two population means are different when the variances are known and the sample size is large.
- Z-statistic follows a normal distribution.
- In Z-tests assume that the population standard deviation is known.
Frequently Asked Questions on Z-Test
A z test is a statistical test in hypothesis testing to determine whether two population means are different when the population variance is known and the sample size is large.
The z-score or z-statistic is a number that represents how many standard deviations above or below a data point is from the population mean in normal distribution.
We can find the critical z-score from the z-table in the following steps.
Step-1: Get a confidence level
Step-2: Calculate the area under the z-distribution curve to the left.
Step-3: Look for the calculated area in the z-table.
Step-4: The sum of the corresponding values for the calculated area is the value of critical z-score.
We suggest you read this article on how to read the z-table for more details.
Yes, you can use the z-test when the number of samples is less than 30 if the population variance is known. The z-test is typically used when working with a normal distribution and known population parameters.
Z-test is preferred over t-test in following conditions:
- Large sample size.
- Population variance is known.
- Normal distribution of data.
The z-distribution is normal distribution with “0” mean and “1” standard deviation. The t-distribution shape is similar to the normal distribution with heavier tails. T-distribution shape depends on the data degrees of freedom.
We can use one sample z-test for means to determine:
- If the average part diameter is 15mm.
- Whether the average monthly stock return is greater than 2%.
Two sample z-tests for means can be used in the following conditions.
- Determine if there is a difference in average wait time at two restaurants.
- Compare a website’s earnings with two different layouts or the performance of two sections in a class.
We can use one sample z-test for proportion to:
- Determine if the sample rejection proportion is similar to the part rejection proportion during production.
- Whether the proportion of government school students passing the IIT exam is similar to the national proportion.
We can use two sample z-test for proportion to:
- Compare the review of a product from two age group of peoples.
We can use two sample z-test for means to compare the accuracy of two machine learning algorithms on a given data.