We can not infer 100% accurate information about the population from sample data. Therefore, we are always concerned about whether our sample data reflects the actual population while making business decisions based on sample data. We can rely on confidence level and margin of error to get the actual picture of the population.
Table of Contents
ToggleWhat is Margin of Error?
The margin of error indicates the difference in the results from testing on sample data and the actual population in percentage points. In other words, it determines the precision of results.
For example, Statistical results from sample data with a 90% confidence interval and ±4 percentage point margin of error indicate the following points.
- 90% of the time we take sample data, the statistical test results will be in ±4 percentage points of the population value.
- Let’s consider a case where the part rejection rate in production is 10%. In 90 samples out of 100 samples we pick from production, the part rejection rate will be 6 to 14%.
The margin of error gives a range of values below and above the sample statistic in a confidence interval. A lower margin of error indicates better and more precise statistical results.
- We can use the margin of error when the sample data is random.
MOE and Confidence Interval
The confidence interval is a range of values where our estimate lies with a confidence level. We apply a margin of error to the confidence interval to understand how precise our estimate is.
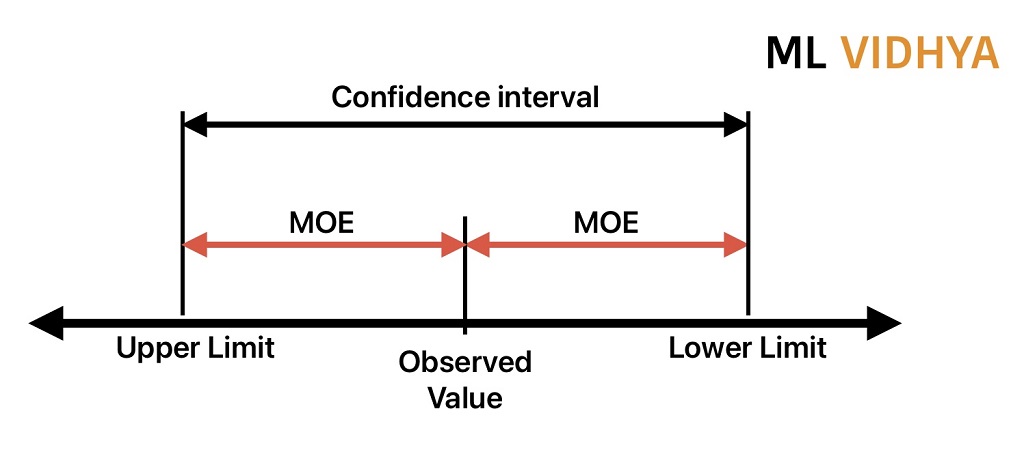
- Confidence Interval gives the range of a parameter with a certain level of Confidence.
- Mathematically MOE is half of the limit of the confidence interval.
How to calculate the Margin of Error?
We can calculate the MOE from sample parameter statistics or sample proportion data.
MOE (Sample Proportion) = Critical value x Population Standard deviation
MOE (Sample Parameter Statistic) = Critical value x Sample Standard error
Calculation of the Margin of error from Sample Parameter Statistic
We will understand the MOE calculations using an example where where we have the sample data and following problem statement is given.
Problem Statement
Calculate the margin of error for a 90% confidence level of 1000 parts manufactured from machine A has an Average diameter of 15 mm with a standard deviation of 0.15.
Step-1: Find the critical value
The critical value is either a t-score or a z-score. We required degree of freedom and significance level to calculate the critical t-value.
From z-table
Z-value = 1.645
Step-2: Find the Sample Standard Error
Standard Error = Standard Deviation / √ (sample size)
Standard Error = 0.15 / √ (1000) = 0.00474
Step-3: Calculate the margin of Error
MOE (statistic) = Critical value x Sample Standard error
MOE = 1.645 * 0.00474 = 0.0078 => 0.78%
Step-4: Result Interpretation
Therefore, the MOE for a 90% confidence level is approximately 0.00780 or 0.78%. This means that we can be 90% confident that the true average diameter of the parts manufactured from machine A falls within 15±0.0078 mm.
Calculation the Margin of error from Sample Proportion
Prior Conditions
n * p̂ ≥ 10
n * (p̂ – 1) ≥ 10
Calculation Formula
Margin of Error = z * √ [ p̂ * ( 1 – p̂ ) / n ]
z = z-score for selected confidence level, p̂ = sample proportion, n=sample size
We will understand the margin of error calculations using an example where we have sample proportion data and the following problem statement is given.
Problem Statement
Calculate the margin of error for a 90% confidence level if 810 people out of 1500 think positively about the current government.
The 810 people who think positively about the current government represent our sample proportion.
Step 1: Find the critical value (z-score)
You can calculate the z-score from z-table. We suggest you to read this article on how to calculate the z-score from the z-table if confidence level is given.
Z-Score for 90% Confidence Level = 1.645
Step 2: Find Sample Proportion (p̂)
Sample Proportion (p̂) = Number of Positive Responses / Total number of responses
p̂ = 810 / 1500 = 0.54 => 54%
Step-3: Calculate the Margin of Error
Margin of Error = z *√ [ p̂ * (1 – p̂) / n]
= 1.645 * √ [0.54 * (1 -0.54) / 1500]
= 1.645 * √ [0.0001656] = 1.645 * 0.01286856635
MOE= 0.02116879165=> 2.116%
Step-4: Results Interpretation
So, the margin of error for a 90% confidence level is approximately 0.02116879 or 2.11%. This means that you can be 90% confident that the true proportion of people who think positively about the current government falls within 54%±2.11%.
Factors affecting the Margin of Error
Here is the list of factors that affect the MOE. We will discuss these points in details.
- Sample size
- Sample proportion
- Population Variability
- Confidence Level
Impact of sample size on MOE
The larger the sample size, the smaller the margin of error, and vice versa.
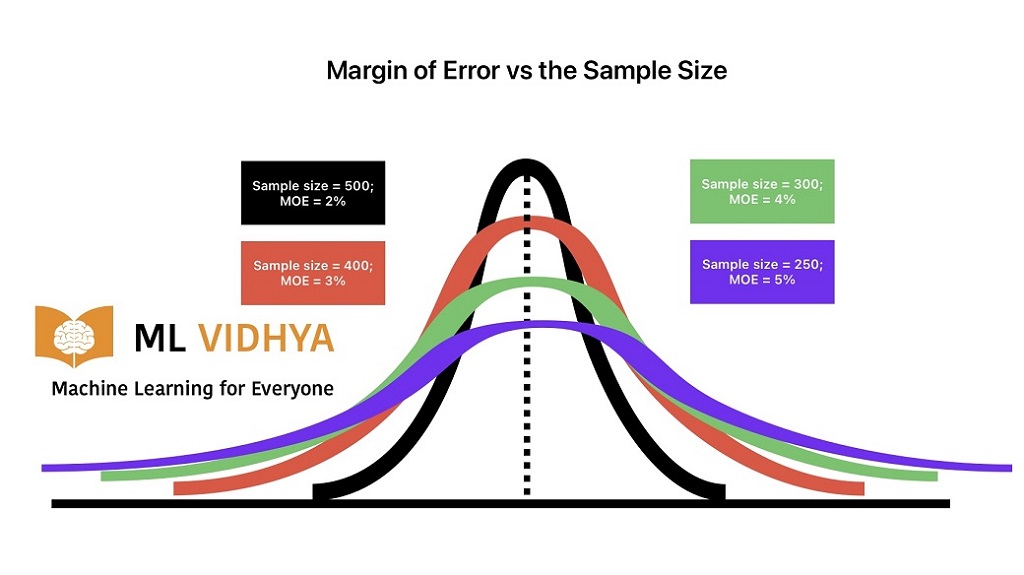
- When the sample size increases, the sample proportion becomes closer to population proportion.
- When the sample size reduces, it will not represent the population proportion.
Impact of sample proportion on MOE
The margin of error increases as the sample proportion comes closer to 50%, whereas it reduces when the sample proportion is closer to 0% or 100%. It happens because the standard error is highest when the sample proportion is 50%.
Impact of population variability on MOE
Variability in data indicates the spread in data points. Therefore, MOE decreases with a decrease in data variability and vice-versa.
Impact of confidence level on the MOE
As the confidence level increases, the critical value also increases. That results in an increase in MOE.