Table of Contents
ToggleWhat is Correlation Coefficient?
| Correlation Coefficient | Correlation Type | Example |
|---|---|---|
| 0 | No-Correlation | a change in one parameter will not impact the other parameter. |
| -1 | Perfectly Negative Correlation | An increase in one parameter will decrease the other. |
| +1 | Perfectly Positive Correlation | An increase in one parameter will increase the other. |
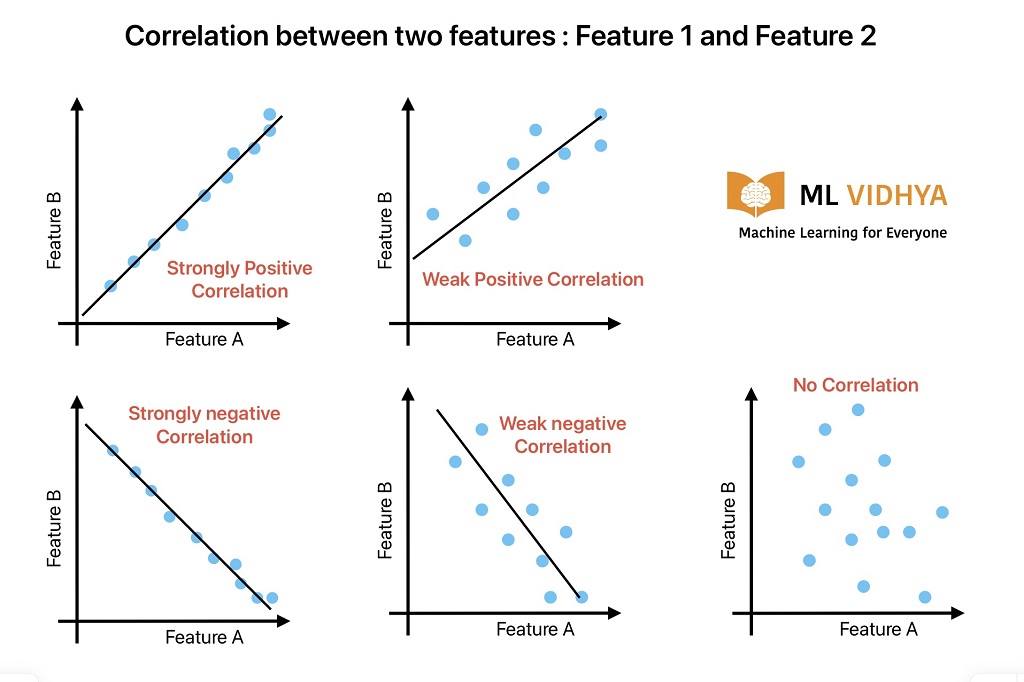
The correlation coefficient tells us the strength of the relationship between two variables. In other words, a correlation coefficient tells us how changing a variable will impact the other variable. Its value lies between -1.0 and +1.0.
Correlation Example
- If there is no relation between a student’s performance and the type of diet it has. Performance and diet parameters are not correlated.
- The stock-A and stock-B are correlated if a change in one stock impacts another stock.
A correlation between two variables does not tell us cause and effect relation or if a change in one variable (variable-1) is due to a change in another (variable-2)
Application Example
- We can use the Pearson coefficient to determine the relation between stocks and make investment decisions.
- For statistical hypothesis testing and determine the relation between two variables.
- We use correlation coefficient in machine learning for feature selection.
Types of Correlation Coefficient?
We can find the correlation coefficient between two variables using one of the following methods.
- Pearson Coefficient
- Spearman Coefficient
Pearson Correlation Coefficient
Pearson Coefficient is also known as Pearson’s r’, PPMCC. It represents the strength and direction of the linear relation between two quantitative variables (X and Y) on the same interval or ratio scale.
Linearity between two variables on a scatter plot represents the Pearson correlation coefficient.
| Person Coefficient | Relationship |
|---|---|
| .5 to 1 | Strongly Positive |
| .3 to .5 | Moderate Positive |
| 0 to .3 | Weak Positive |
| 0 | No Correlation |
| -.3 to 0 | Weak Negative |
| -.5 to -.3 | Moderate Negative |
| -1 to -.5 | Strongly Negative |
Prior Conditions to calculate the Pearson Correlation Coefficient
- Both variables are quantitative.
- Normal distribution of variables.
- Data is without outliers.
- The relationship between both variables is linear.
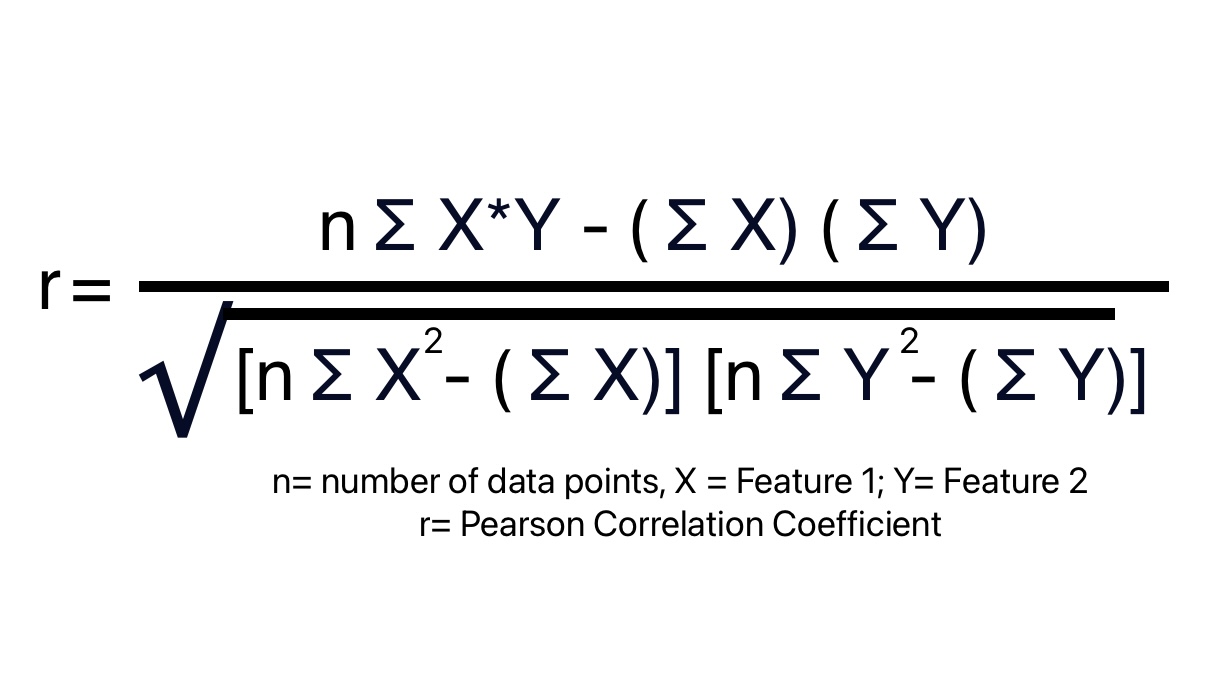
Formula for Pearson Correlation Coefficient
How to calculate Pearson Correlation Coefficient
We will do hands-on calculations to understand the impact of a person’s age on earnings. The person is working in the IT industry.
Step-1: Get the Data
| Age | Earnings in thousand of $ |
|---|---|
| 23 | 40 |
| 37 | 70 |
| 37 | 100 |
| 31 | 41 |
| 24 | 35 |
| 38 | 110 |
Step-2. Make sure data is meeting prior conditions for the Pearson coefficient
Step-3 Calculate the inputs
| X | y | X2 | y2 | X*y | |
|---|---|---|---|---|---|
| 23 | 40 | 529 | 1600 | 920 | |
| 37 | 70 | 1369 | 4900 | 2590 | |
| 37 | 100 | 1369 | 10000 | 2700 | |
| 31 | 41 | 961 | 1681 | 1271 | |
| 24 | 35 | 576 | 1225 | 840 | |
| 38 | 110 | 1444 | 2100 | 4180 | |
| Total | 190 | 396 | 6248 | 31506 | 13501 |
Step-4 Place all values in the formula and calculate the coefficient
r = (6 * 13501-190 * 396) / √ ([6 * 6248 - 1902] * [6 * 31506 - 3962])
r=(81006-75240) / √ ([37488-36100] * [189036-156816])
r = 5766 / 6687.4 = 0.86
Step-5 Results Interpretation: Reporting the Pearson correlation coefficient in APA Style
High Correlation between a person’s earnings and age, r = .86
Note: “0” is not used while representing Pearson coefficient.
Significance Testing for Pearson Coefficient
Further, we can use the Pearson Correlation Coefficient to test whether the relationship between two variables is significant.
Pearson correlation of the sample (r) is an estimate for the Pearson correlation of population rho (p).
Problem Statement: We can use Sample Pearson Correlation to infer if the population Pearson correlation is significantly different from zero.
Null hypothesis: p=0
Alternative hypothesis: p ≠ 0
Step 2: Find the critical t-value
Degrees of freedom (for Pearson correlation tests) = n – 2 = 4
Significance level (alpha) = 0.05
Critical t-value for two-tailed test = 2.78
Step 3: Compare the t value to the critical value
If the t-statistic > critical t-value:
The relationship is statistically significant (p < alpha). We can reject the null hypothesis.
If the t-statistic > critical t-value:
The relationship is not statistically significant (p > alpha). We Can’t reject the null hypothesis.
Since 3.372 (t-value) > 2.78 (critical t-value) =>
We can reject the null hypothesis that the Pearson correlation coefficient of the population (p) is not 0. In other words, age and earnings have a significant relationship (p > 0.05).
A high correlation between a person’s earnings and age, r = 0.86, and the relationship between the two variables is also statistically significant.
Spearman Correlation Coefficient
Spearman correlation Coefficient is a nonparametric measure of correlation. We represent Spearman correlation coefficient by ‘p'(rho). It measures the strength and direction of the relation between two ranked variables.
Spearman correlation measures the strength of the linear relation between paired data. Its value lies between -1 and + 1.
Prior Conditions for Spearman Correlation Coefficient
- Both variables are ordinal.
- Variable data is not normally distributed.
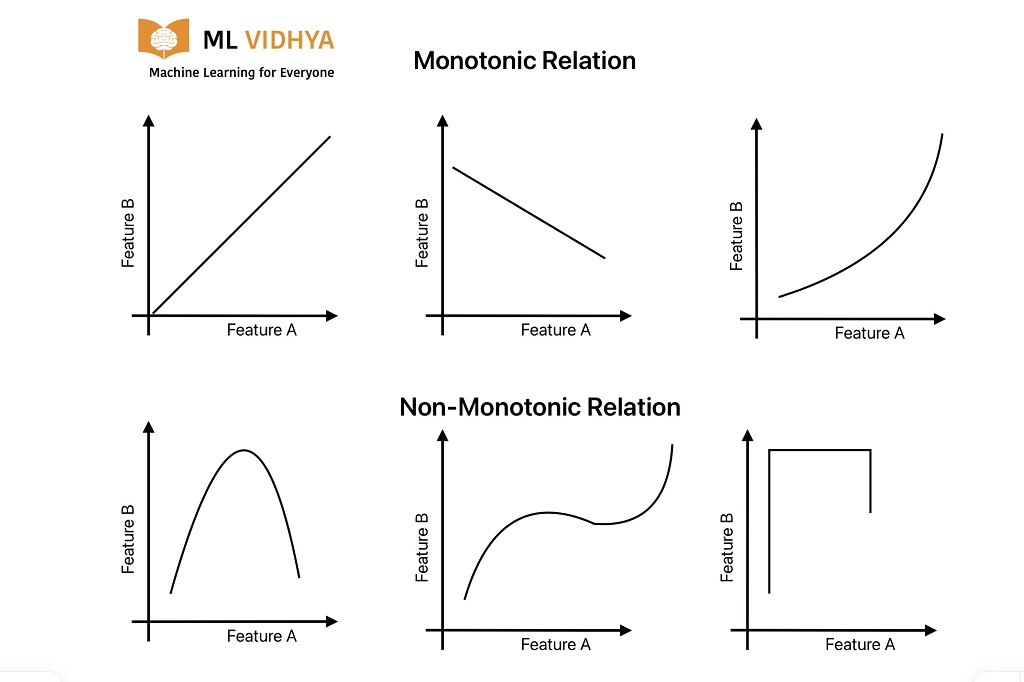
- The relationship between variables is non-linear and monotonic.
- Data may have outliers.
What is the monotonic relationship?
A monotonic function never decreases or increases as the independent variable changes. In other words, when the x variable increases, the y variable increases and decreases.
Spearman Correlation Coefficient Calculation Formula
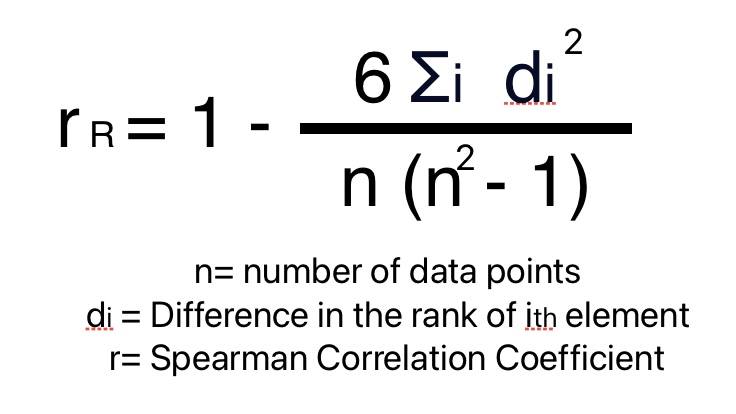
Hands-on Calculations for Spearman Correlation coefficient
We will do Spearman Correlation hands-on calculations to understand the correlation between students’ math and science marks.
Step-1: Get the Data
| Student | Math Rank | Science Rank |
|---|---|---|
| 1 | 5 | 4 |
| 2 | 10 | 9 |
| 3 | 2 | 1 |
| 4 | 9 | 10 |
| 5 | 1 | 2 |
| 6 | 7 | 5 |
| 7 | 3 | 6 |
| 8 | 8 | 7 |
| 9 | 4 | 3 |
| 10 | 6 | 8 |
Step-2: Calculate d and d2
| Student | Math Rank | Science Rank | d | d2 |
|---|---|---|---|---|
| 1 | 5 | 4 | 1 | 1 |
| 2 | 10 | 9 | 1 | 1 |
| 3 | 2 | 1 | 1 | 1 |
| 4 | 9 | 10 | 1 | 1 |
| 5 | 1 | 2 | 1 | 1 |
| 6 | 7 | 5 | 2 | 4 |
| 7 | 3 | 6 | 3 | 9 |
| 8 | 8 | 7 | 1 | 1 |
| 9 | 4 | 3 | 1 | 1 |
| 10 | 6 | 8 | 2 | 4 |
Step-3:Calculate the Spearman's Rank correlation coefficient
Spearman Correlation Coefficient= 1 - [ (6 * 24) / (10 * (10 2 - 1)]
=1 - [144 / 990]
=1 - 0.145 = 0.8545
Spearman's Rank Correlation is 0.8545.
Step-4: Results Interpretation
High correlation (.8545) between a student math and science rank is observed.
Note: “0” is not used while representing Pearson coefficient.