Z score table is a standard normal distribution table. It tells us what percentage of values fall below a certain z-score in a normal distribution. We use the z-table to calculate the p-value or critical z-value and decide on the null hypothesis. In this article, we try to understand how to read z-table.
Table of Contents
ToggleWhat is Z-Score
To understand the z-table, firstly you need to understand what is z-score?
The z-score or z-statistic is a number that represents how many standard deviations above or below a data point is from the population mean in normal distribution.
How to interpret z-score
The below table will give you an indication of the meaning of the z-score value.
| Z Score Value | Significance |
|---|---|
| 0 | Data is at Mean. |
| 1 | Data is one standard deviation away from mean. |
| Positive | A +ve value indicates data is above mean. |
| Negative | A -ve value indicates data is below mean. |
Common values for Z-Score with Confidence Level
The below table will give you critical z-score values for the most common confidence level.
| Confidence Level | Critical Z-Score |
|---|---|
| 90 % | 1.645 |
| 95 % | 1.96 |
| 98 % | 2.33 |
| 99 % | 2.516 |
How to use z table?
A z score table tells us the area underneath a normal distribution curve, to the left of the z-score. In other words, it determines the p-value of a particular z-score.
We can use the z-table to:
- Find the critical z score provided we have the area under the curve to the left. And the value of this area depends on the confidence level.
- Calculate the p-value or the area to the left of the curve from the z-score.
How to use z score table to calculate the critical z-value from confidence level
We can use the z-table to calculate the critical z-score from confidence level to compare it with z-test statistic or calculated z-score. Further, this value is used to decide on the null hypothesis.
Step-1: Calculate the area under the curve to the left
You can calculate the allowable area under the curve to the left from the confidence level.
Area under the curve to the left (A) = (1+Confidence Level) / 2
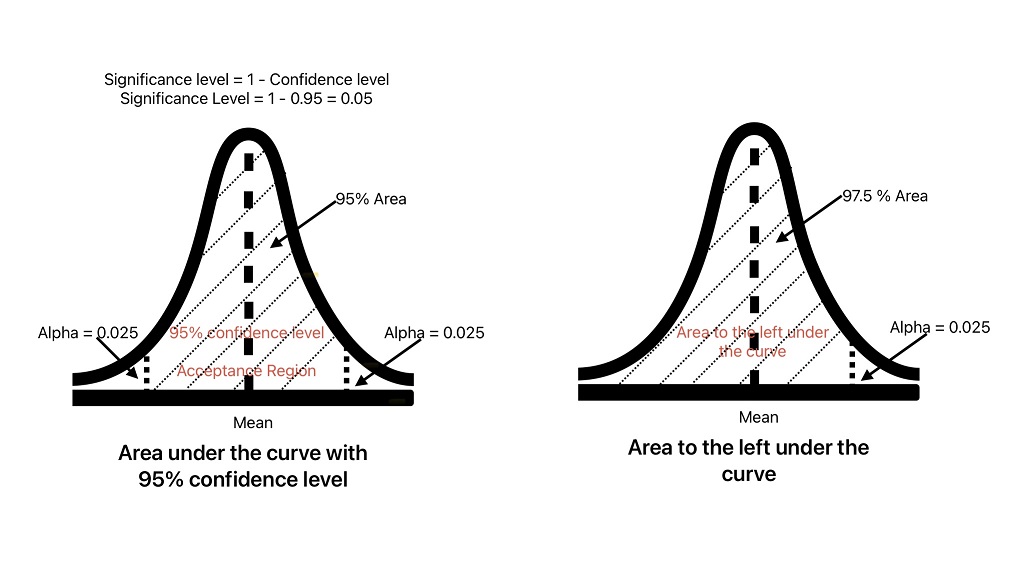
Example: Calculate the area under the normal distribution curve for a two-tailed test with a 95% confidence level.
Solution: For a two-tailed test the confidence level is distributed on the left and right of the mean value.
A= (1+0.95) / 2 = 0.975
Step-2: Look for the calculated area under the curve value in positive z-table
The next step is to look for the calculated area value in the positive z-score table.
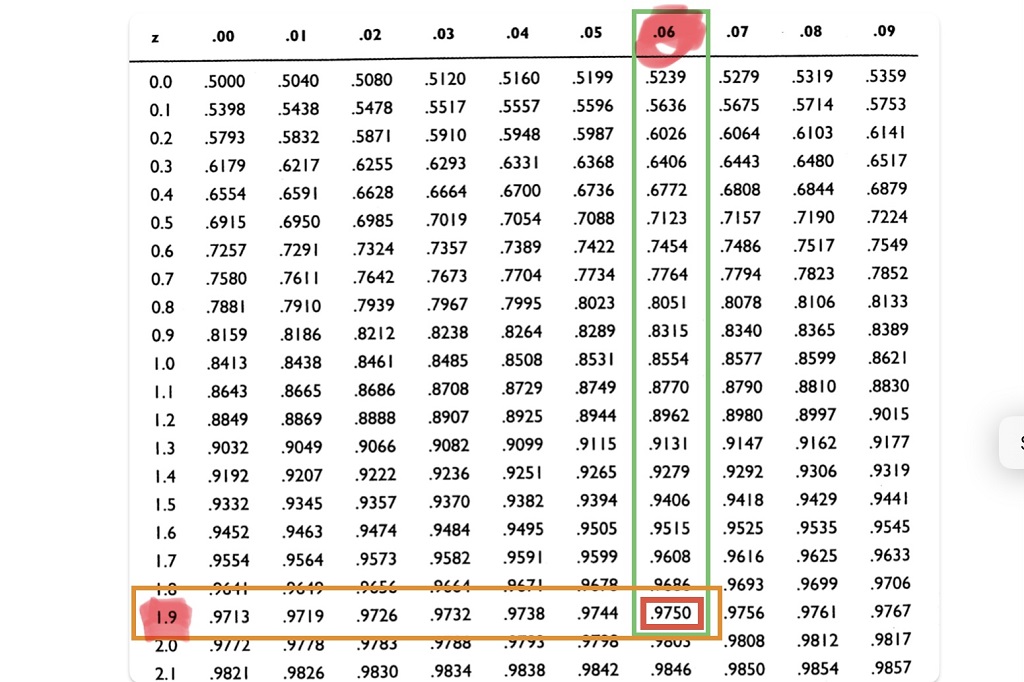
As shown above, mark the value when you find it.
Step-3: Write down the corresponding z values in row and column
The next step is to note down the z-score in the z-score table corresponding to the earlier marked area.
For the calculated area under the curve to the left (A) = 0.975
Z-score in row =1.96
Z-score in column =0.06
Calculate the final critical Z-score
The critical z-score is equal to the sum of the calculated z score in the row and column.
Critical Z-Value = Z-value in row + z value in column =1.9+0.06=1.96
How to use the Z score table for p-value
The Z-score represents the number of standard deviations a data point is from the mean.
- The left tail p-value represents the probability of getting a z-score less than the given z-score.
- The right tail p-value represents the probability of getting a Z-score greater than the given Z-score.
We can use the z-table to find the p-value (area under the curve) from the z-statistic. This is similar to how we calculated the z-score from the area under the curve. For the p-value, we are calculating the area under the curve from the z-score.
Step-1: Look for rows and column in z score table
The first step in calculating the p-value from the z-score is to divide the z-score into two parts.
- The first number will be the z-score value up to two decimal places.
- For the second number, you need to subtract the first number from the z-score and convert it up to two decimal places.
Example: Find the p-value for a two-tailed test and z-score equal to 1.96
Solution: First Number = 1.9, Second Number = 1.96 – 1.9 = 0.06
Step-2: Identify the number in z-table
The next step is to identify the first number and second number in the first column and first row respectively.
Step-3: Calculate the p-value
The next step is to find the value at the intersection of the selected number. The intersection number gives the area under the curve to the left for the given z-score.
For a two-tailed test:
Area to the left of the normal distribution curve = 0.9750
Right-hand side rejection area = 1-0.975 = 0.025
Since this is a two-tailed test, the right-hand-side rejection area will be equal to the left-hand-side rejection area.
Total rejection area = 0.05
p-value = 0.05
Frequently Asked Questions on Z Score Table
Z-score gives information on how many standard deviations a data point is from the mean in a sample data.
We can use z-scores to compare two samples that may have different scales or measurement units. In machine learning, we can use a z-score for anomaly detection or find outliers.
A negative z-score indicates that the data point are below the mean.
Z-Statistic = (x – mean) / standard deviation.
Z = 105-100/2=2.5
The Z-score for the part with 105 mm length is 2.5. It indicates that this part length is 2 standard deviations above the mean part length.