T distribution table is a table that shows the critical values of the t-distribution or critical t score. The critical t-value defines the threshold for significance for the hypothesis test. You can decide to accept or reject the null hypothesis based on the critical t-score.
We suggest you read this article on one-sample t-tests, paired t-tests, and independent sample t-tests before jumping to this article.
Table of Contents
ToggleRequired inputs to find the critical t-value from the T Distribution Table
Following is the list of inputs we need to calculate the critical t-value from the t-score table.
- Type of statistical test: One-tailed or Two-tailed test.
- Degree of freedom for the t-test.
- Acceptable significance level or alpha.
How to use t-distribution table?
To understand how to use the t-distribution table, firstly we need to understand the major components of a t-score table.
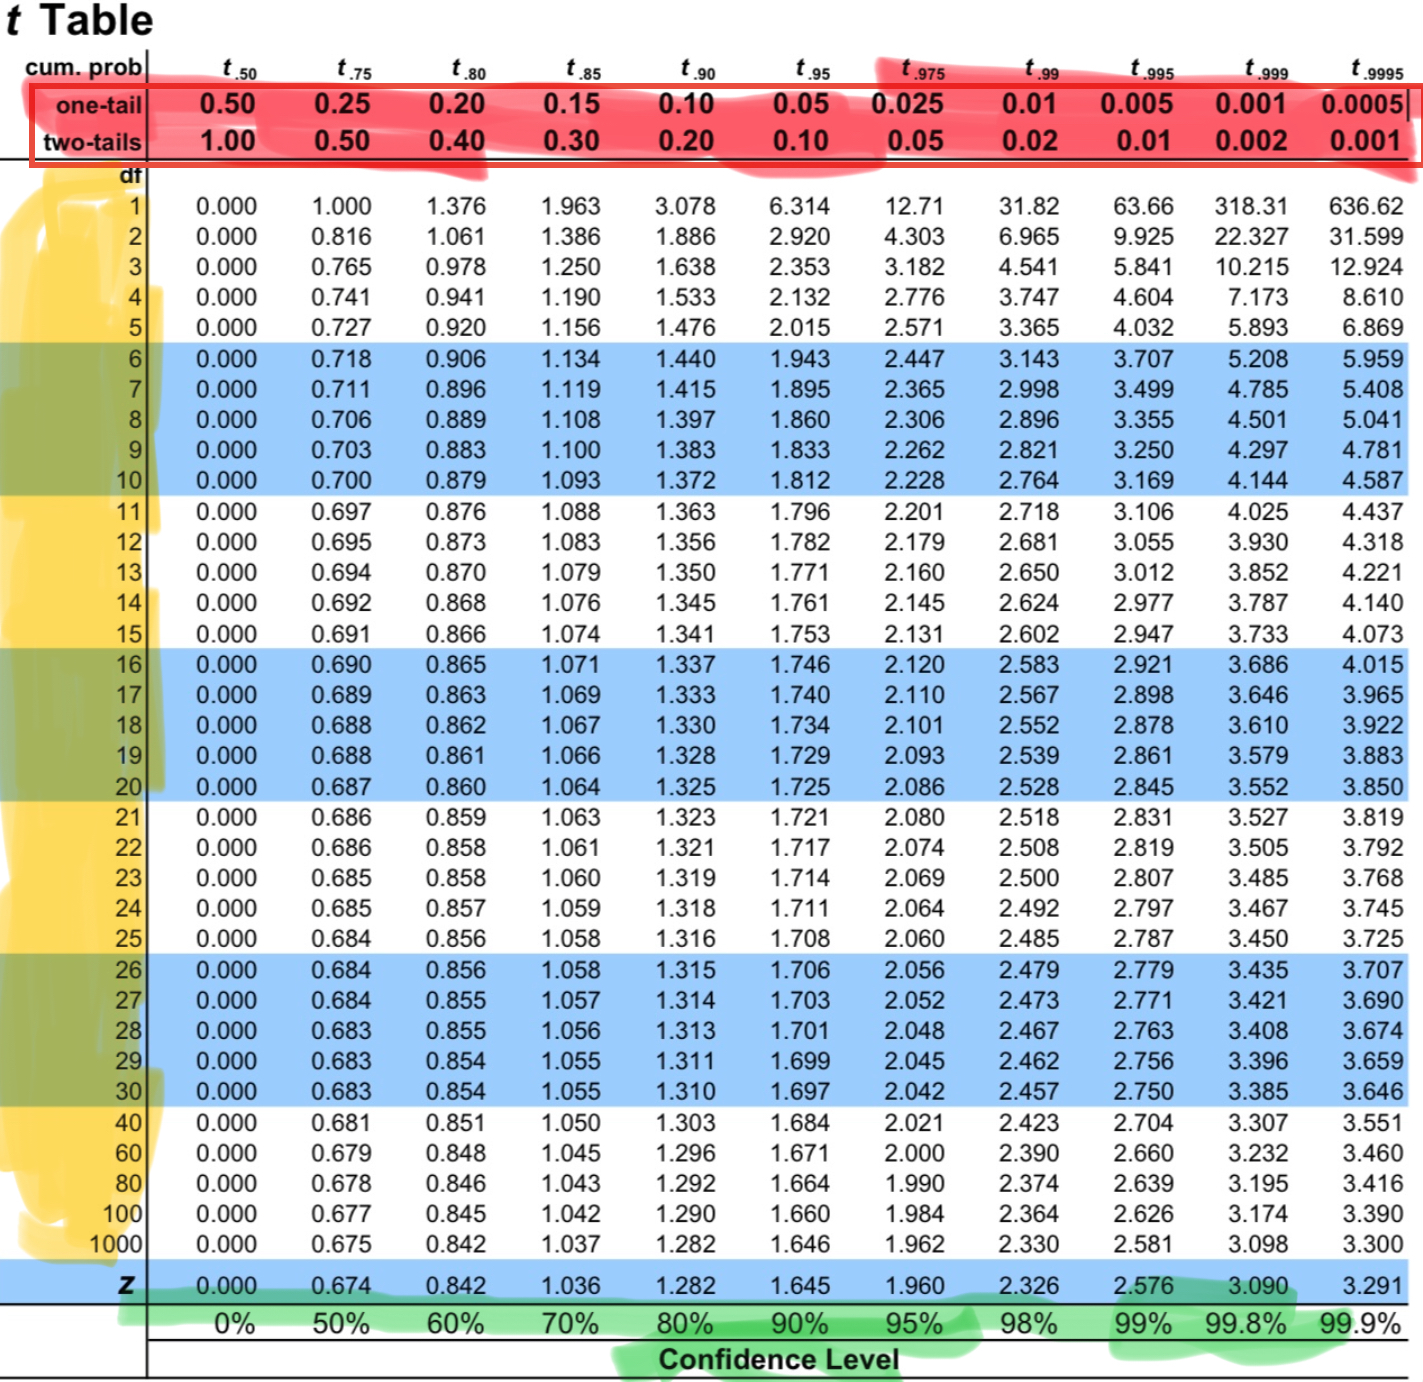
The above image shows major components in a t-distribution table. We will use these components to find the critical t-value to decide on hypothesis testing.
- The 2nd and 3rd rows marked with red color shows the cumulative probability values for one-tailed and two-tailed test respectively.
- 1st column highligted with yellow indicates the degree of freedom in the t-test.
- The last row shows the confidence level values.
- All other values inside the table are critical t-values.
Steps to use the t score table with example
We will understand the use of a t-table using an example with the following inputs.
- Type of test = one-tailed test
- Significance Level = 0.05
- Degree of freedom =20
Here is the list of steps we need to follow to use the t distribution table to find the critical t-value.
Step 1: Select the degree of freedom in the first column.
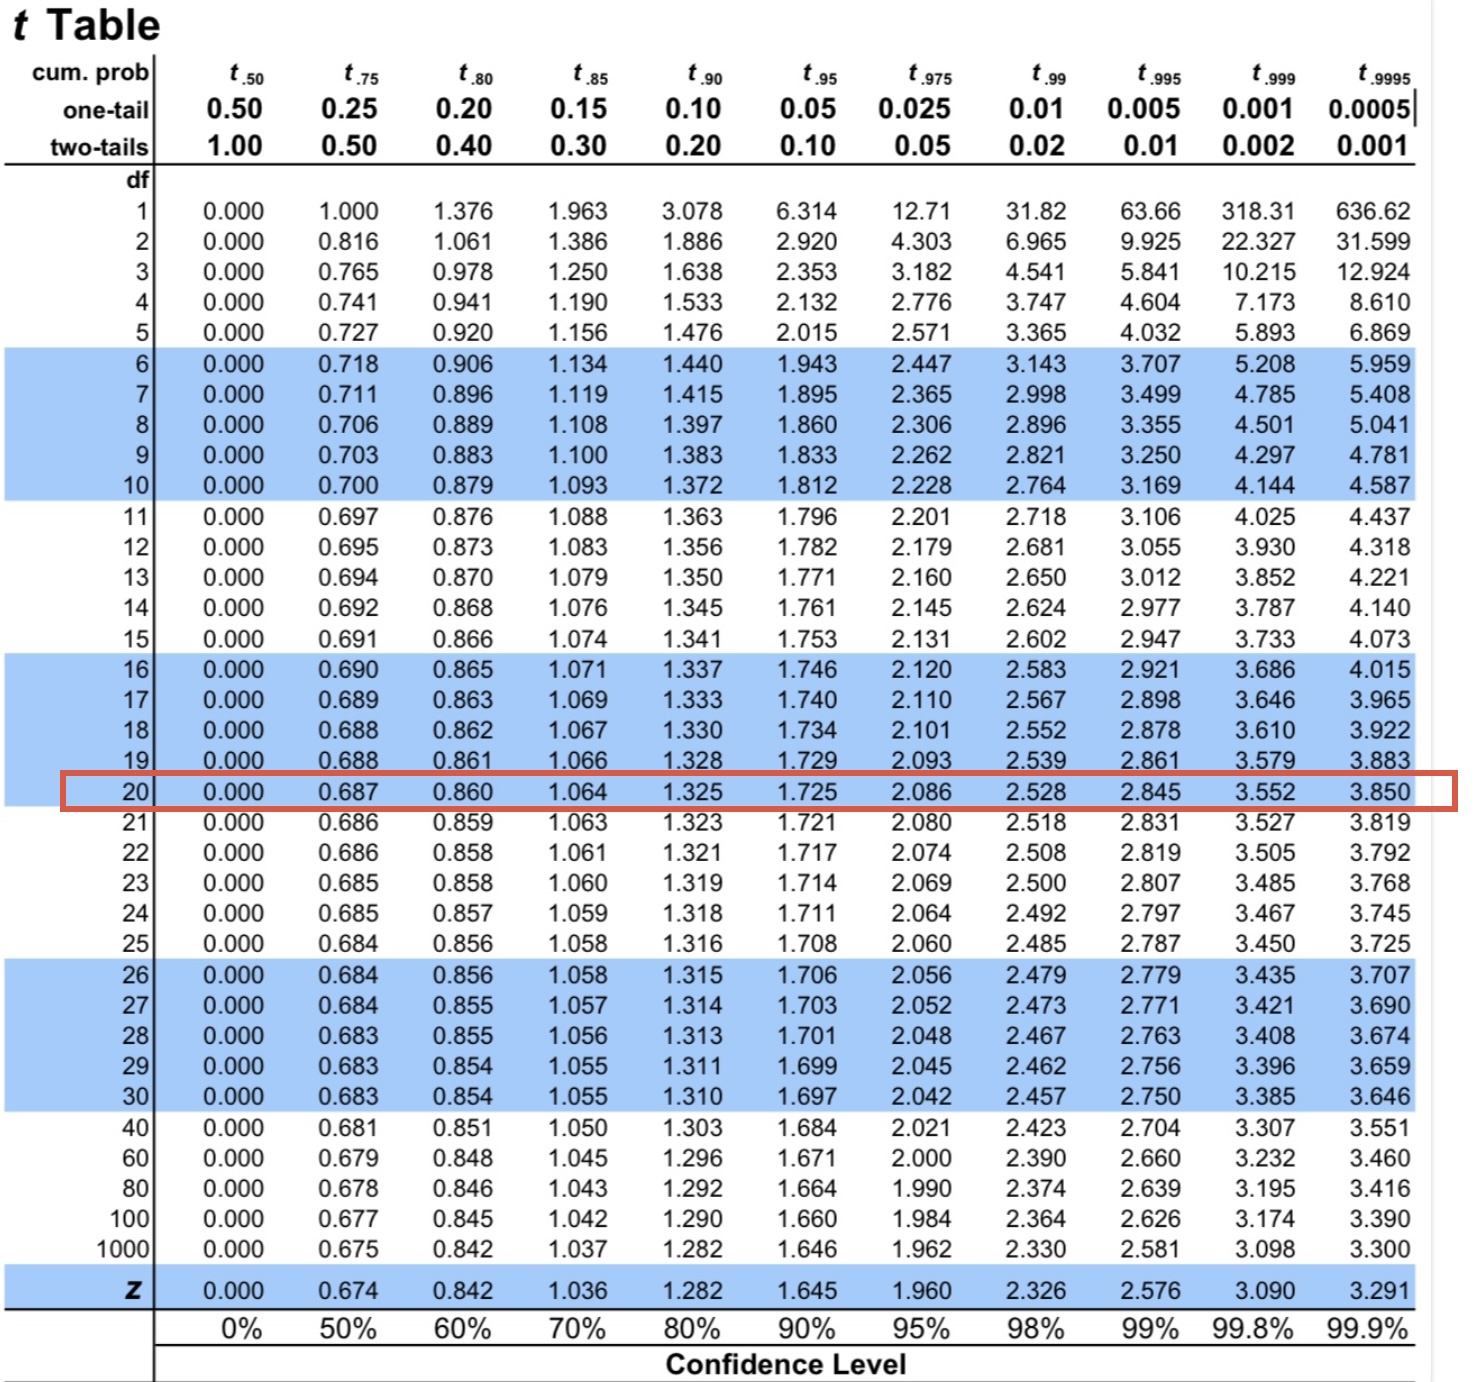
The selected row indicates the possible critical t-value with selected DOF (Marked as red row).
How to calculate the Degree of Freedom
| Significance Test | Formula for DOF |
|---|---|
| One sample t-test Confidence interval Dependent / Paired sample t-test |
DOF = n-1; n= number of samples |
| Independent sample t-test | DOF = n1+n2-2; n1, n2= number of samples in group-1 and group-2 respectively |
| Linear Regression Pearson/Spearman correlation |
DOF = n-1 |
What if degree of freedom is not available in t-table?
We can use one of the following two techniques if the required DOF is not available in the t-distribution table.
- Interpolation Technique
- Select relatively smaller DOF
In the interpolation technique, we calculate the in-between critical t-value between two values.
For example, if DOF = 50 is not available in the t-table.
- Calculate critical value for DOF = 40 and DOF = 60;
- Critical Value (DOF=50) = [Critical Value (DOF=40) + Critical Value (DOF=60)] /2
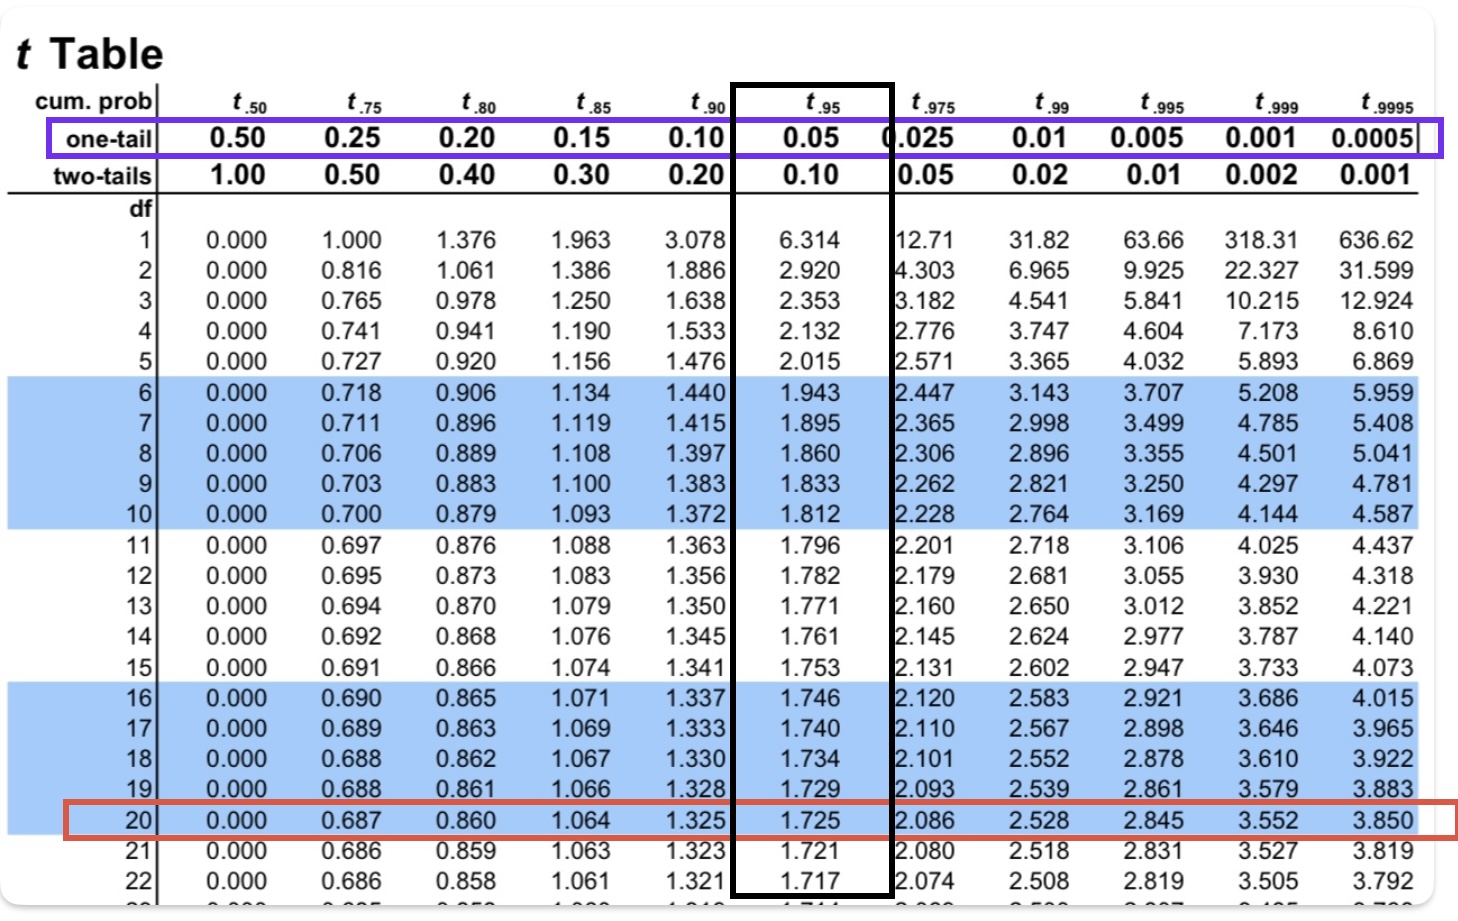
Step 2: Select the alpha according to type of significance test
The next step is to select the alpha according to the type of significance test (one-tailed or two-tailed test). The selected columns indicate the possible critical t-value with selected alpha (Marked as a black column).
Formula to calculate alpha from confidence level
Alpha = 1 – Confidence Level
Step 3: Find critical t-value
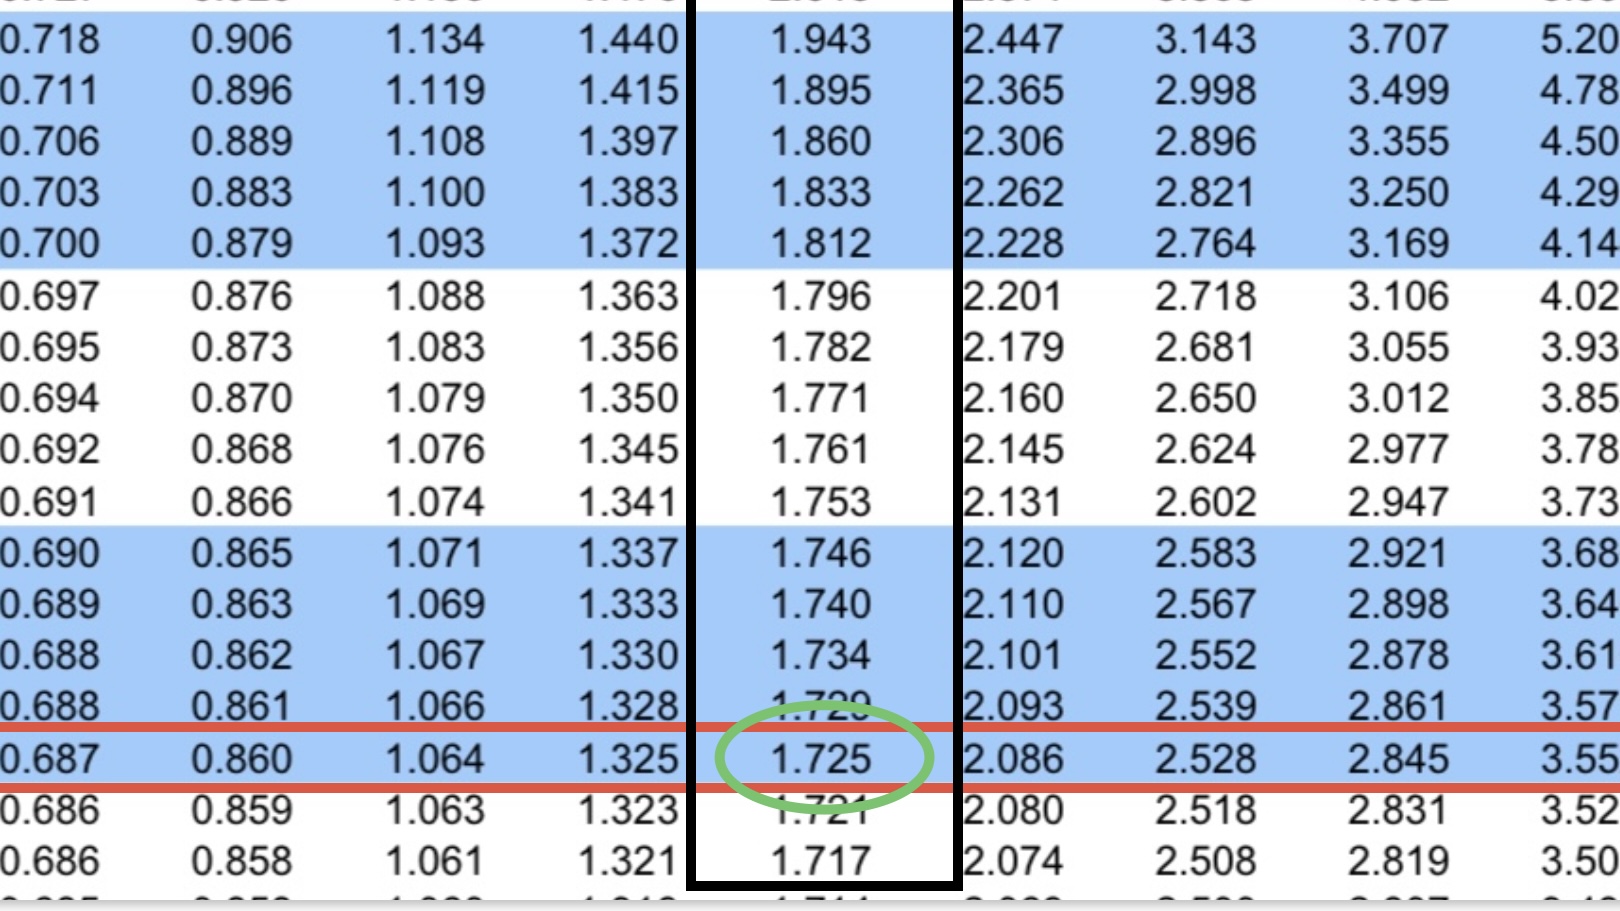
The common value in selected row and column indicates the critical t-value (encircled in green) for required DOF and alpha.
Significance of critical t-value?
We can use the critical t-value to compare it with test statistics and decide on the null hypothesis.
Test Statistic > Critical Value: Reject the Null Hypothesis: Test results are statistically significant.
Frequently asked Questions on T Distribution Table
Type of t-test = two tailed, Number of samples = 20, DOF = 20-1 = 19, Alpha=0.05
From t distribution table:
Critical t-value = 2.093
Type of t-test = two tailed, Number of samples = 20, DOF = 20-1 = 19, Alpha=0.05
From t distribution table:
Critical t-value = 2.093
Type of t-test = two-tailed, n1 = 30, n2=22, DOF = 30+22-2 = 50, Alpha=1-0.9=0.1
From the t distribution table:
When we look at t-table dof=50 is not available. Therefore we will calculate the critical t-value using the interpolation technique.
Critical t-value (DOF=40 and DOF=60)= 1.684, 1.671
Critical t-value (DOF=60)= (1.684+1.671)/2 = 1.6775
You can use the probability distribution function from scipy.stats library to calculate the critical t value
import scipy.stats as stats
alpha = 0.05, DOF = 19
# Calculate the critical t-value for a two-tailed test
critical_t_value = stats.t.ppf(1 – alpha / 2, DOF)
# Display the result
print(f”Critical t-value for given input= {critical_t_value:.3f}”)
We can reject the null hypothesis.