Paired t-test or Dependent sample t-test is a type of t-test that is used in machine learning for hypothesis testing. This article covers one sample t-test with examples and how we can implement this in Python.
Table of Contents
ToggleWhat is Dependent or Paired t-test
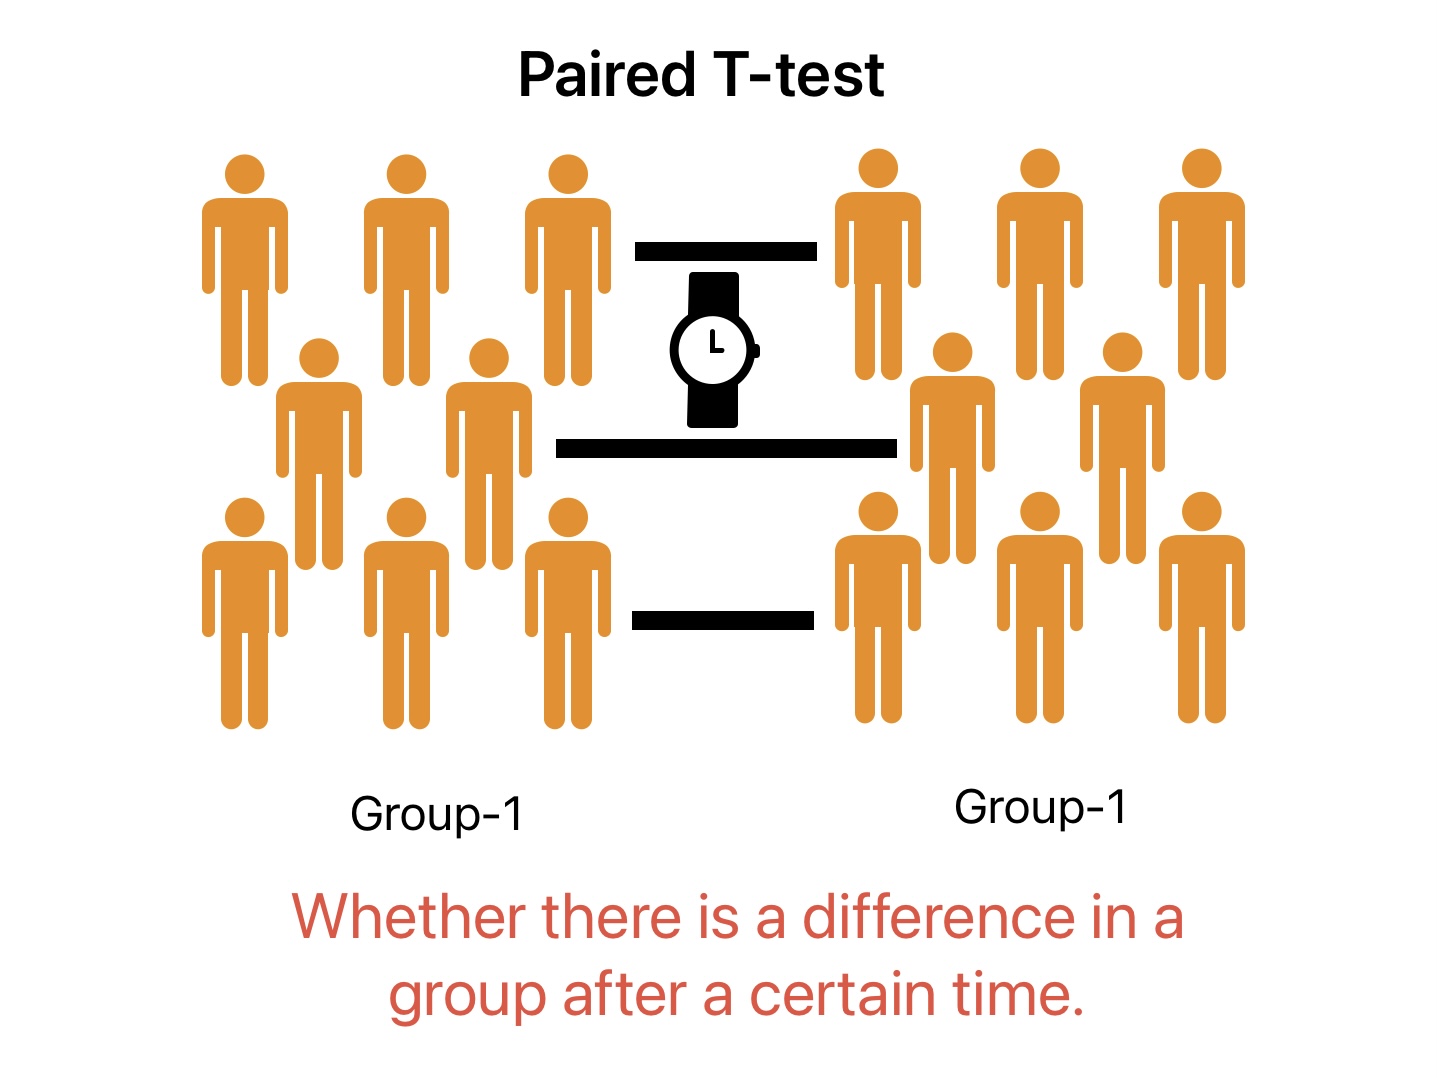
Paired Sample t-test is a statistical test to determine whether there is a difference between two dependent groups. In other words, it checks if the mean value of two dependent groups is significantly different.
Application Example for Dependent t-test
We can use a dependent t-test to determine if the part manufacturing tolerance improves after we improve the manufacturing process. In this, the machine remains the same, but we check the improvements after the update in the manufacturing process.
In the Paired t-test, the two measured values are available for one sample data. For example, we can check the impact of yoga on weight loss.
- Step-1: Note down the weight for the sample population (male or female).
- Step-2: The sample population starts doing yoga for 4 months.
- Step-3: Note down the sample population weight.
Prior Requirements and Assumptions for Paired T-test
- All observations within a group are independent.
- There are two dependent groups or samples. Each paired measurement is from the same subject.
How Paired T-test Work?
The first step is to calculate the difference in each paired case. For example, We calculate the difference in weight for a person before and after a change in diet.
Next step is to calculate the mean of the difference. In other words, we calculate the mean weight loss for pairs.

The last step is to statistically prove there is no difference between the mean of the difference with 0 (Considering no difference). Now, this is a one-sample t-test problem. We can conclude whether to reject or accept the null hypothesis based on the calculated mean value and the standard error.
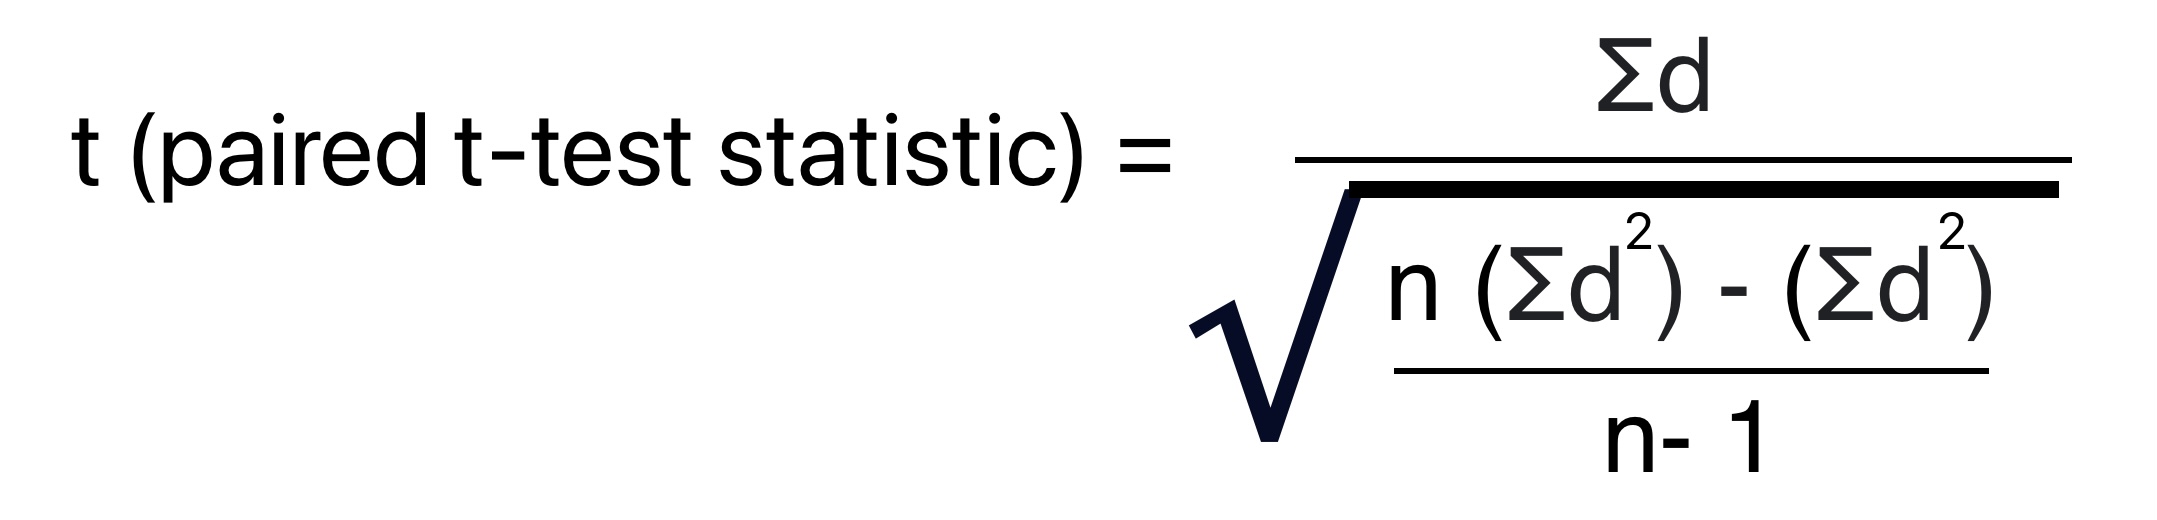
Paired t-test Calculation Formula
Application example of implementation of dependent sample t-test
Problem Statement
A school wants to test the impact of extra math classes on student performance. For this purpose, we conduct equal-difficulty exams before and after additional math classes. Using paired t-tests, we will statistically prove the extra math class’s impact on the student’s performance.
Step 1: Get the Data
We can get the required data in the following steps:
Step-1.1: Conduct the math exam for Group-A students.
Step–1.2: Organize an additional training for Group-A students.
Step–1.3: Conduct the math exam-2 (with similar difficulty level of exam-1) for Group-A students.
| Studen ID | Exam-1 Score | Exam-2 Score |
|---|---|---|
| 1 | 60 | 65 |
| 2 | 50 | 52 |
| 3 | 73 | 79 |
| 4 | 42 | 55 |
| 5 | 50 | 49 |
| 6 | 80 | 91 |
| 7 | 71 | 71 |
| 8 | 55 | 60 |
| 9 | 61 | 69 |
| 10 | 44 | 50 |
Step 2: Calculate the Mean Difference
| Studen ID | Exam-1 Score | Exam-2 Score | Difference |
|---|---|---|---|
| 1 | 60 | 65 | 5 |
| 2 | 50 | 52 | 2 |
| 3 | 73 | 79 | 6 |
| 4 | 42 | 55 | 13 |
| 5 | 50 | 49 | -1 |
| 6 | 80 | 91 | 11 |
| 7 | 71 | 71 | 0 |
| 8 | 55 | 60 | 5 |
| 9 | 61 | 69 | 8 |
| 10 | 44 | 50 | 6 |
Step 3: Ensure data is meeting the prior conditions for the t-test
We can plot box charts for two groups to understand data central tendency and variability.
- All observations within a group are independent. : All students are independent of each other’s.
- There are two dependent groups or samples, and paired measurements are from the same subject.
- Ensure the difference in the paired value data is normally distributed.
Step 4: Define null and Alternative Hypotheses.
Null Hypothesis:
There is no difference in student’s marks before and after extra classes.
Alternative Hypothesis:
A student’s performance improves after additional math classes.
Step 5: Decide the Alpha value or the acceptable significance level
As of now, we will consider this as 5% or 0.05.
Step-6: Calculate t-value
| Group | Sample Size | Difference Mean | Variance | Standard Deviation |
|---|---|---|---|---|
| Difference in exam score | 10 | 5.5 | 19.833 | 4.4534 |
n = 10, √n = 3.1622
t (test statistics) = (5.5 – 0) / (4.4534 / 3.1622) = 3.9
Step 7: Find the critical t-value from the t-table.
Find t-value for DOF = 9, Significance Level = 0.05, and two-tailed t-test.
Critical t-value = 2.262
Step-8: Results Evaluation
We can reject the null hypothesis and accept the alternative hypothesis because the calculated t-score or t-value is greater than the critical t-value.
In other words, additional math classes have a positive impact on student performance.
Python code to Paired t-test
We will implement the paired t-test on sample data using the Python SciPy Library.
# Import important Library
import pandas as pd
import numpy as np
# Get the Sample Data
data = {'student_id': ['1', '2', '3', '4', '5', '6', '7', '8', '9', '10'],
'exam1_score': [60, 50, 73, 42, 50, 80, 71, 55, 61, 44],
'exam2_score': [65, 52, 79, 55, 49, 91, 71, 60, 69, 50]}Define Null and Alternate Hypothesis
Null Hypothesis: There is no difference in student’s marks before and after extra classes.
Alternative Hypothesis: A student’s performance improves after additional math classes.
# Significance level (alpha)
alpha = 0.05
Python code to calculate t-statistic for paired t-test
# Calculate the t-statistic

from scipy.stats import ttest_rel

# Perform paired t-test

t_statistic, p_value = ttest_rel(data["exam1_score"], data["exam2_score"])

# Print the results
print(f'T-statistic: {t_statistic}')
print(f'P-value: {p_value}')
T-statistic: -3.9053938137319952
P-value: 0.0035898209106550536
# Result Interpretation
if p_value < alpha:
    print("Reject the null hypothesis. There is a significant difference between the means.")
else:
    print("Fail to reject the null hypothesis. There is no significant difference between the means.")
Reject the null hypothesis. There is a significant difference between the means.