One sample t-test is a type of t-test that is used in machine learning for hypothesis testing. This article covers one sample t-test with examples and how we can implement this in Python.
Table of Contents
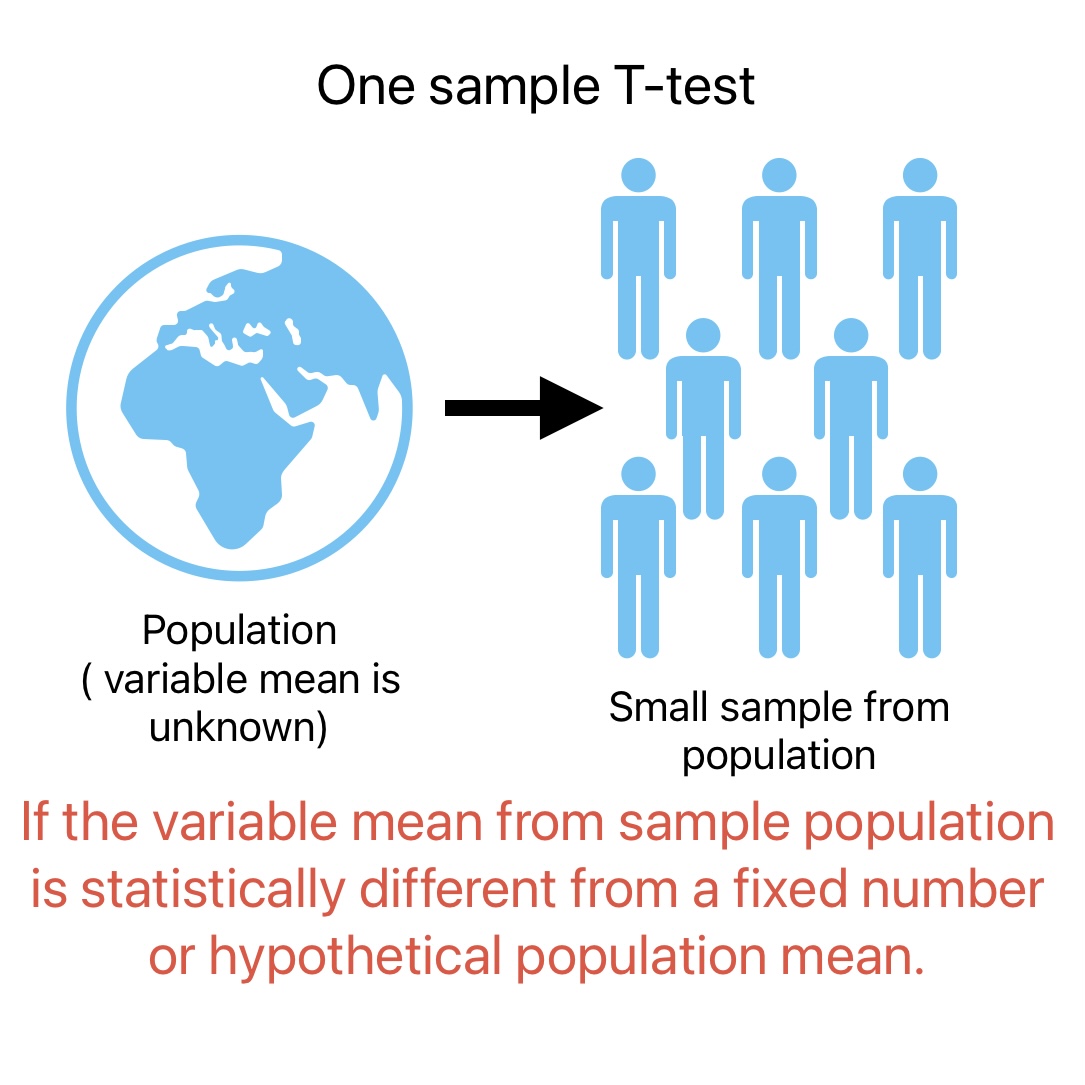
ToggleWhat is one Sample t-test?
Application Examples
- Determine if the mean weight of the sample population is statistically different from a fixed value.
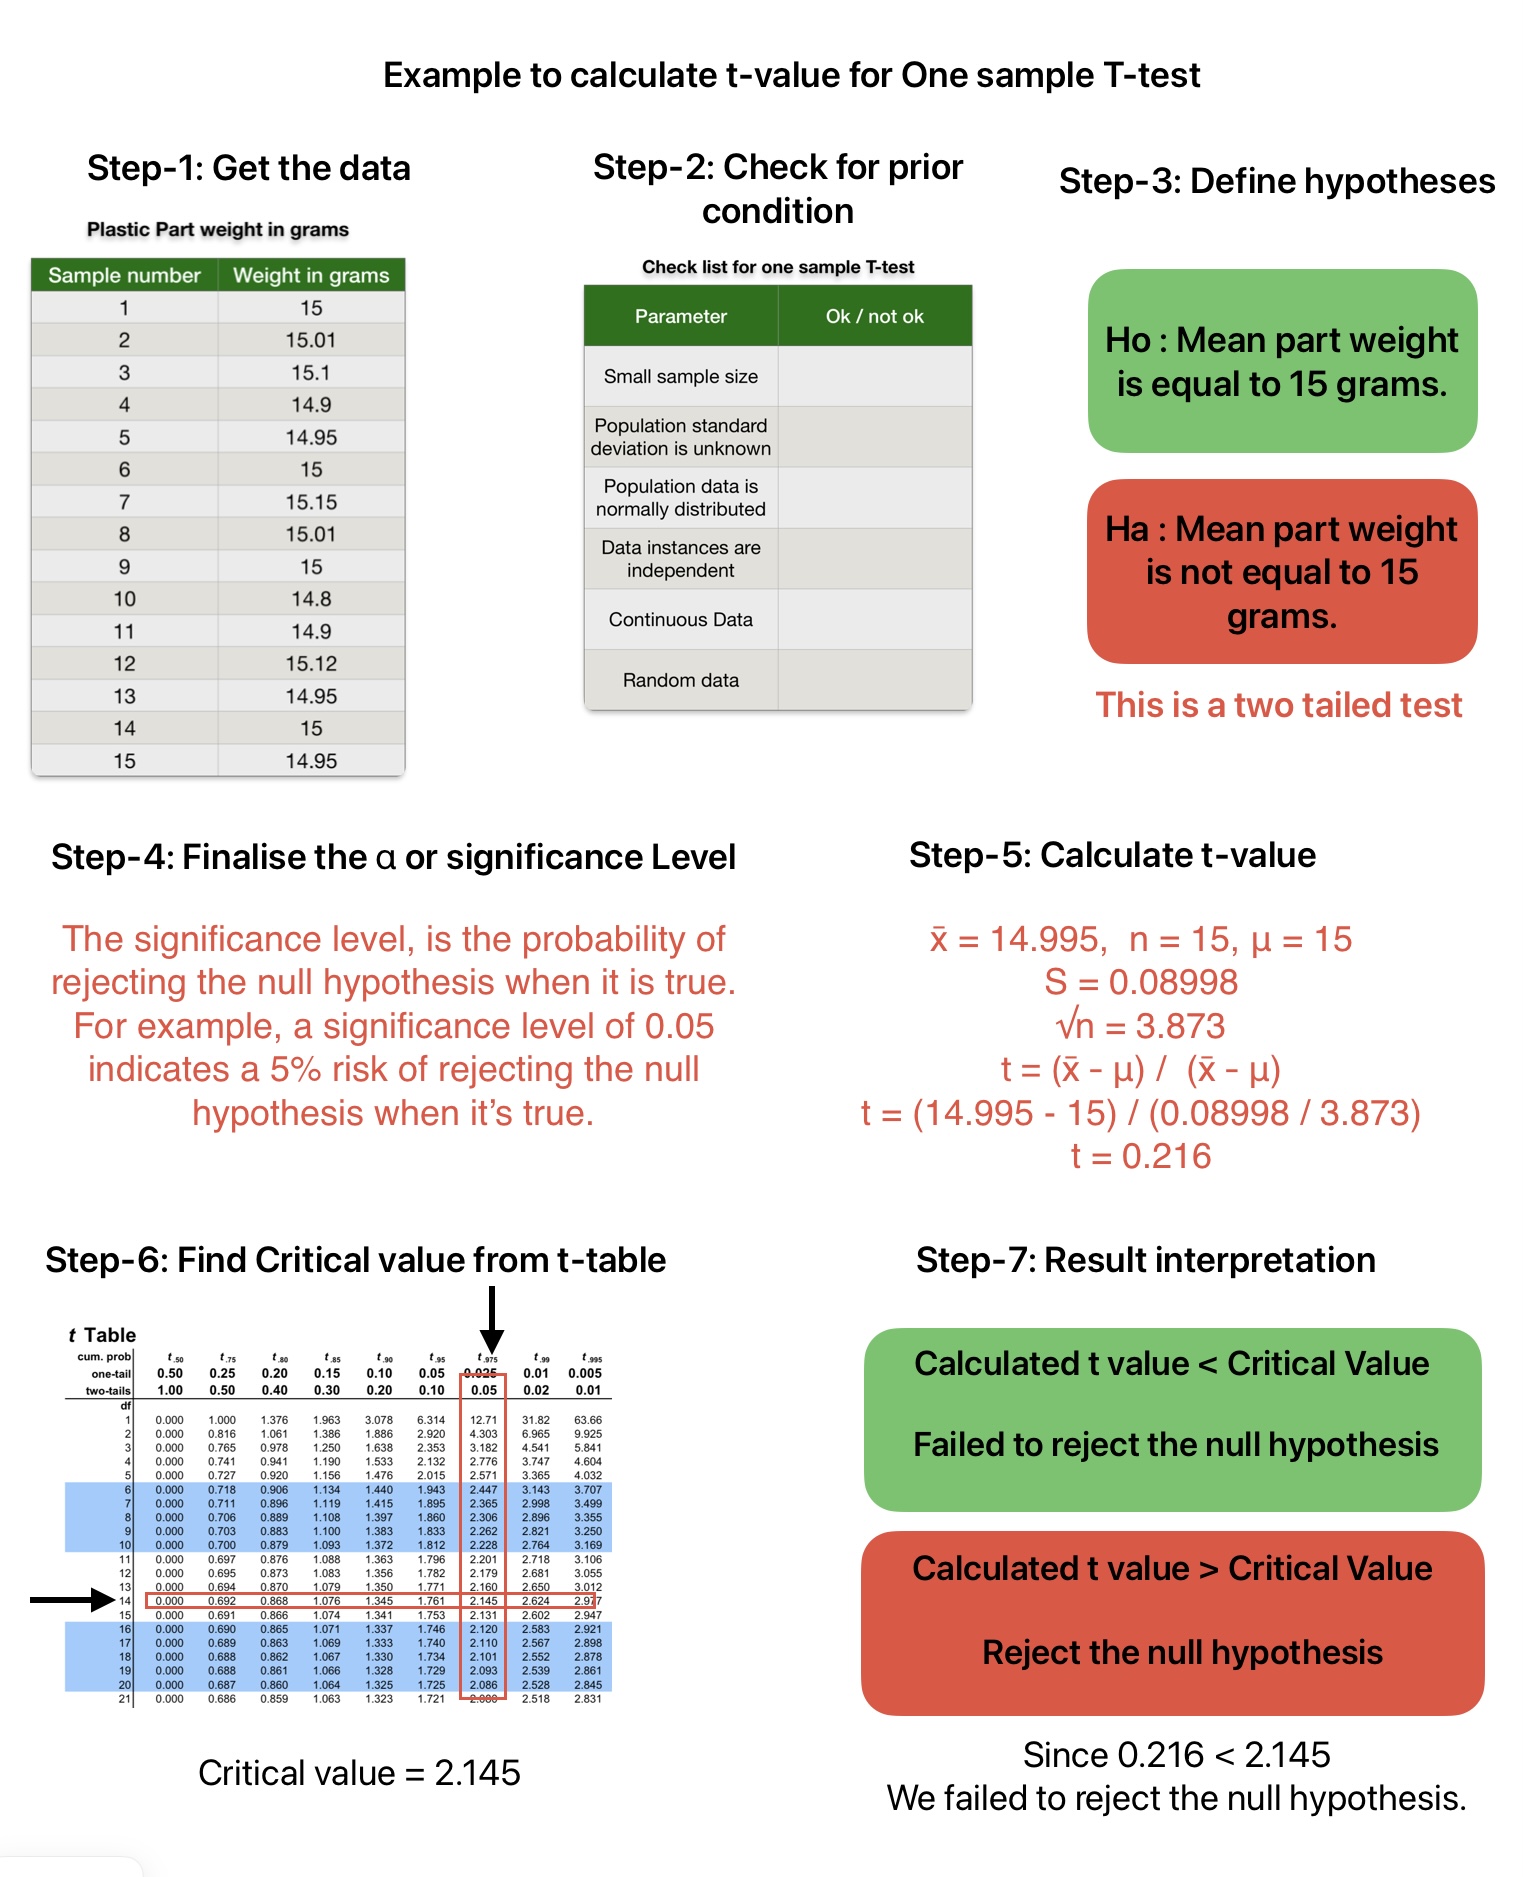
- A plastic part manufacturer can use a t-test to determine if the mean product weight is 15 grams.
Prior Conditions for one Sample t-test
Following are the prior conditions for one sample t-test. We need to verify data for these points to implement one-sample t-test.
- The population standard deviation is not known.
- Sample Size is small (Approx. 30 samples)
- Data Instances are independent.
- Continuous data.
- The population is normally distributed.
- Sample is picked randomly from the population.
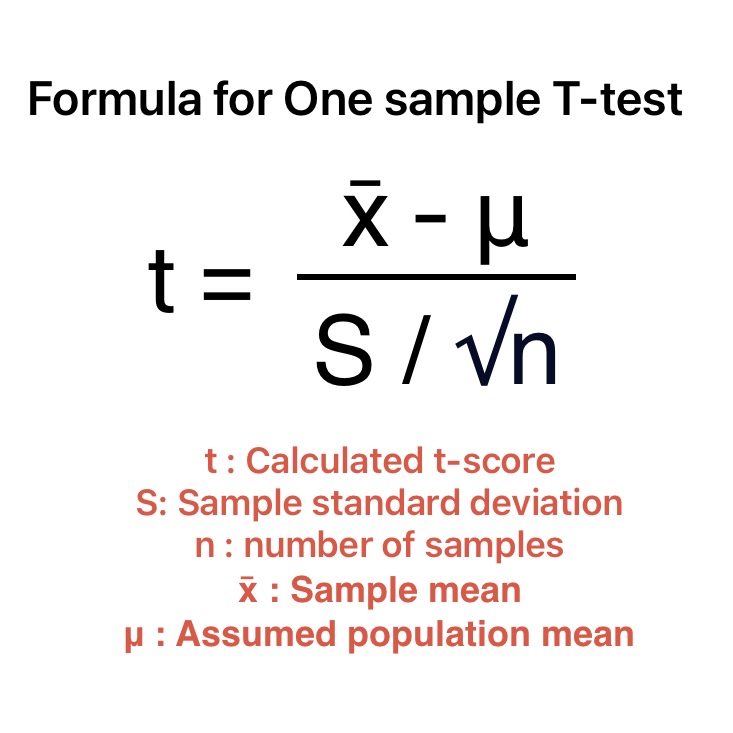
Calculation Formula for One Sample T-Test
Application example for one sample t-test
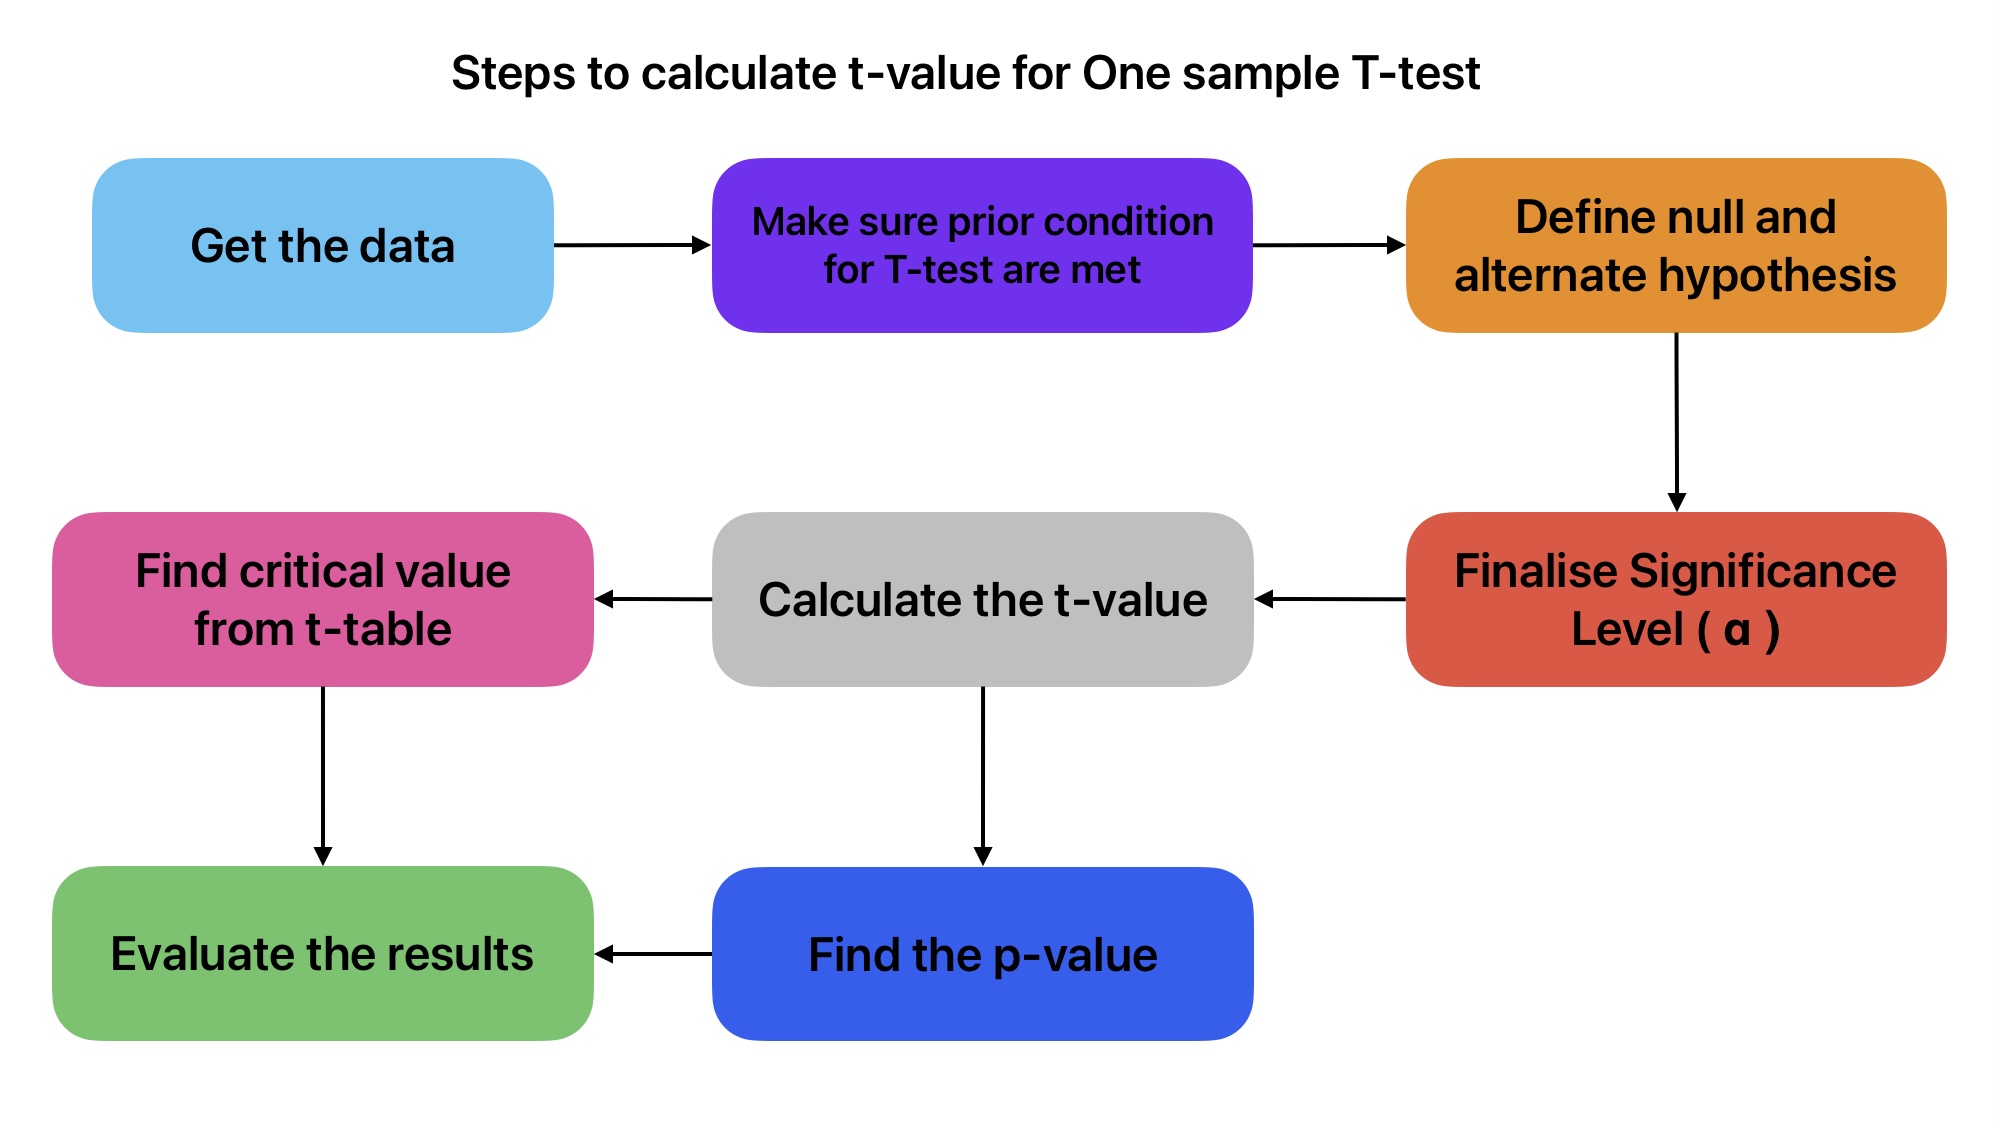
Here is the list of steps to calculate the t-value and evaluate results for significance testing.
While John was working with a plastic part manufacturer, his manager came to you with the following problem.
Manager: John, is there any way to make sure the mean part weight for XYZ is 15 grams without measuring every part?
John: Yes, we can do a hypothesis test to ensure XYZ part weight is 15 grams with a 95% confidence level.
Manage: Please proceed with this and let me know the results ASAP.
John: I will collect data from production and will show you the results.
Problem Statement: We want to ensure that the manufactured part’s mean weight is 15 grams with a 95% confidence level.
Python code to implement One-sample t-test
We will implement the one-sample t-test on sample data using manual calculations and the Python SciPy Library.
Prepare for input data according to problem Statement
# Import important Library
import pandas as pd
import numpy as np
# Get the sample Weight data
sample_weight = [15, 15.01, 15.1, 14.9, 14.95, 15, 15.15, 15.01, 15, 14.8, 14.9, 15.12, 14.95, 15, 14.95]Define Null and Alternate Hypothesis
Null Hypothesis: The mean weight of the part is equal to 15 grams.
Alternative Hypothesis: The mean weight of the part is not equal to the 15 grams.
# Define Hypothesized population mean
population_mean = 15

# Define the Significance level (alpha)
alpha = 0.05

# Calculate the Degrees of freedom
dof = len(sample_weight) - 1
Python code to calculate the t-value for One Sample t-test
# Import the Required Library
import statistics
import math

# Calculate the sample mean
sample_mean = statistics.mean(sample_weight)
print("Sample Mean:", sample_mean)

# Calculate the sample standard deviation
sample_std = statistics.stdev(sample_weight)
print("Sample Standard Deviation", sample_std)
Sample Mean: 14.989333333333333 Sample Standard Deviation 0.08979871671582781
# Calculate t-value statistic using one sample t-test formula
calculated_t_value =  (sample_mean - population_mean) / (sample_std / math.sqrt(population_mean))
print("Calculated t-value:", calculated_t_value)
Calculated t-value: -0.4600491395693469 # Calculate Critical t-value: We can use t-table as well.
critical_t_value = stats.t.ppf(1 - alpha / 2, df=dof)
print("Critical T-Value:", critical_t_value)Critical T-Value: 2.1447866879169273
# Results Interpretation
if abs(calculated_t_value) > critical_t_value:
    print("Reject the null hypothesis.")
else:
    print("Fail to reject the null hypothesis.")
Fail to reject the null hypothesis.
Python code using SciPy Library to calculate the t-value
# Import SciPy Library
from scipy import stats

# Calculate t-value and p-value for One sample t test
t_value, p_value = stats.ttest_1samp(sample_weight, population_mean)

# Print the results
print("T-Value:", t_value)
print("P-Value:", p_value)
T-Value: -0.4600491395693468 P-Value: 0.6525446094245332
# Result Interpretation by comparing p_value and significance level
if abs(p_value) < alpha:
    print("Reject the null hypothesis.")
else:
    print("Fail to reject the null hypothesis.")
Fail to reject the null hypothesis.
Now you go to your boss to show him the results.
Manage: John, have you got the results?
John: Yes, the results are in our favor. We failed to reject the null hypothesis. With a 95% confidence level, we can say the part weight is 15 grams.
Manager: Good, what variation we can expect in this part weight?
John: For this, we need a Confidence Interval. (You can read more about Confidence Interval Here)
Manager: Please present these results as well.